Search Results for: ftk

What is Digital Forensics

Digital forensic science is a branch of forensic science that focuses on the recovery and investigation of material found in digital devices related to cybercrime. The term digital forensics was first used as a synonym for computer forensics. Since then, it has expanded to cover the investigation of any devices that can store digital data.…

The post What is Digital Forensics appeared first on Cybersecurity Exchange.

What Is Cyber Crime? What Are the Different Types of Cyber Crime?

Cyber crime, as the name suggests, is the use of digital technologies such as computers and the internet to commit criminal activities. Malicious actors (often called “cyber criminals”) exploit computer hardware, software, and network vulnerabilities for various purposes, from stealing valuable data to disrupting the target’s business operations. The different types of cyber crime include:…

The post What Is Cyber Crime? What Are the Different Types of Cyber Crime? appeared first on Cybersecurity Exchange.

Volatolity — Digial Forensic Testing of RAM on Kali Linux

In our some previous articles (Scalpel, Foremost etc) we have discussed how to can run digital forensics on hard disk drives. But data is not only stores there this included RAM and the swap partition, or paging, file, which is an area of the hard disk drive.

Now the issue is RAM’s data is very volatile, means the data in the RAM easily lost, when there are no electrical charge or current in the RAM chip. With the data on RAM being the most volatile, it ranks high in the order of volatility and must be forensically acquired and preserved as a matter of high priority.

volatility tutorial kali linux forensics testing of ram

Many types of data & forensics artifacts reside in Random Access Memory (RAM) and the paging file. They are might be login passwords, user information, running and hidden processes or even encrypted passwords are just some of the many types of interesting data that can be found when we run digital forensics test of RAM.

In our this article we use Volatility Framework to perform memory forensics on our Kali Linux system.

Volatility Framework is an open-source, cross-platform framework that comes with many useful plugins that provide us very good information from the snapshot of memory. This also known as memory dump.

The concept of Volatility is very old but it’s works like magic. Not only analyzing running and hidden processes, is also a very popular choice for malware analysis.

As we said Volatility Framework is a cross platform framework. It can be run on any OS (32 and 64 bit) that supports Python including:

  • Windows XP, 7, 8,8.1, and Windows 10.
  • Windows Server 2003, 2008, 2012/R2, and 2016.
  • Linux 2.6.11 – 4.2.3 (including Kali, Debian, Ubuntu, CentOS, and more).
  • macOS Leopard (10.5.x) and Snow Leopard (10.12.x) and newer.

Volatility supports several memory dump formats (both 32- and 64-bit), including:

  • Windows crash and hibernation dumps (even Windows 7 and earlier).
  • VirtualBox.
  • VMWare .vmem dump.
  • VMware saved state and suspended dumps—.vmss/.vmsn.
  • Raw physical memory—.dd.
  • Direct physical memory dump over IEEE 1394 FireWire.
  • Expert Witness Format (EWF)—.E01.
  • QEMU (Quick Emulator).

Even we can convert between these formats and boosts of being able use Volatility with other tools.

Before use Volatility Framework we need to create a memory dump for testing. We can use several tools such as FTK imager, Helix, LiME can be used to acquire the memory image or memory dump. Then it can be investigated and analyzed by the Volatility Framework.

For this tutorial we are going to use a Windows XP image (named cridex.vmem) which is downloaded from here. Volatility have uploaded lots of memory samples publicly available for testing there. We can use them for our practice with the Volatility Framework and enhance our skills. We can download as many as we like and we can use various plugins available in Volatility. In the following screenshot we can see that our dump image is saved on our Desktop for easy access.

memory dump file

Using Volatility in Kali Linux

Volatility Framework comes pre-installed with full Kali Linux image. We can see the help menu of this by running following command:

volatility -h

Then we got the help of Volatility Framework as we can see in the following screenshot:

volatility help menu on Kali Linux

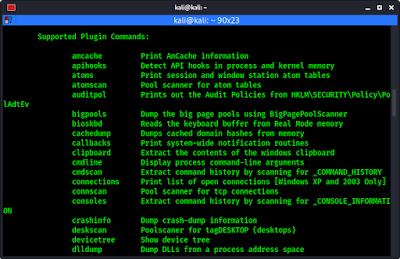
If we scroll down a little bit on the help menu we can find the list of all plugins within Volatility Framework.

Volatility plugins list

This list comes in handy when performing analysis as each plugin comes with it’s own short description. In the following screenshot we can see a plugin with it’s description.

imageinfo plugin's description volatility

Gaining Information using Volatility

This imageinfo plugin will tell us about the image. The format for using plugins in Volatility is:

volatility -f [filename] [plugin] [options_if_required]

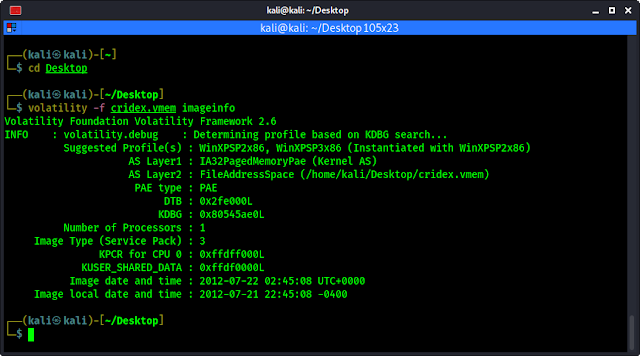
Now we have stored our image file on Desktop so first we change our working directory by using cd Desktop command. Then we run imageinfo plugin to check information of the image by applying following command:

volatility -f cridex.vmem imageinfo

In the following screenshot we can see the information about our image file.

volatility plugin imageinfo

In the above screenshot we can see some information about the image used, including the suggested operating system and Image Type (Service Pack), the Numbers of Processor used and the date and time of the image. Some valuable information we got from this image is listed:

  • WinXP: Windows XP.
  • SP3: Service Pack 3.
  • x86: 32 bit architecture.

We also can see the suggested profiles WinXPSP2x86 (Windows XP Service Pack 2×86), WinXPSP3x86 (Windows XP Service Pack 3×86) but in the image type section we can see that service pack is 3 so we can use “WinXPSP3x86” profile for our analysis.

Process Analysis using Volatility on Kali

To identify & link connected processes, their ID’s, running time and offset locations within the RAM image, we need these four plugins to get started:

  1. pslist
  2. pstree
  3. psscan
  4. psxview

1. Pslist Plugin on Volatility

This plugin or tool shows a list of all running processes, also it gives very crucial information like, Process ID (PID) and the Parent PID (PPID). Not only that it also shows the time when the processes started.

Let we run the pslist first then we explain the things. We use following command:

volatility --profile=WinXPSP3x86 -f cridex.vmem pslist

The following screenshot shows the output of the preceding command:
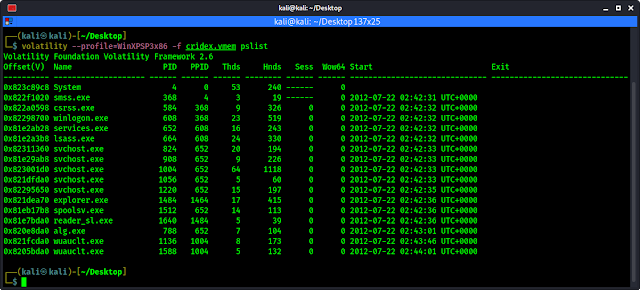
volatility pslist command kali linux
The Finding are discussed following

In the above screenshot we can see the System, winlogon.exe, services.exe, svchost.exe, and explorer.exe services are all started first and then followed by reader_sl.exe, alg.exe, and finally wuauclt.exe.

The PID identifies the process and the PPID identifies the parent of the process. Looking at the pslist output, we can see that the winlogon.exe process has a PID of 608 and a PPID of 368. The PPID’s of the services.exe and the lsass.exe processes (directly after the winlogon.exe process) are both 608, indicating that winlogon.exe is in fact the PPID for both services.exe and lsass.exe.

For those new to process IDs and processes themselves, a quick Google search can assist with identification and description information. It is also useful to become familiar with many of the startup processes in order to readily point out processes that may be unusual or suspect.

The timing and order of the processes should also be noted as these may assist us in investigations. In the above screenshot, we can see that several processes, including explorer.exe, spoolsv.exe, and reader_sl.exe, all started at the same time of 02:42:36 UTC+0000. We can also tell that explorer.exe is the PPID of reader_sl.exe.

In this analysis, we can see that there are two instance of wuauclt.exe with svchost.exe as the PPID.

2. Pstree Plugin on Voltility

pstree is another process identification command that can be used to list processes. pstree shows output the same list of processes as the pslist command did in previous, but identification is also used to know which one child process and which one is parent process.

To run pstree we use following command:

volatility --profile=WinXPSP3x86 -f cridex.vmem pstree

Following screenshot shows the output of the preceding command:

volatility pstree command on Kali Linux

In the above screenshot, the last two processor listed are explorer.exe and reader_sl.exe. The explorer.exe is not indented, while reader_sl is indented, indicating that sl_reader is the child process and explorer.exe is the parent process. This is how we can identify the parent process and child process.

3. Psscan Plugin on Volatility

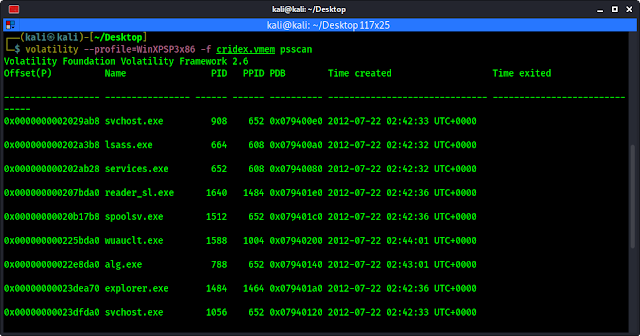
With the help of pslist and pstree we have checked the running processes, now it’s time look for inactive and even hidden processes using psscan. Now this hidden processes may be caused by malwares (like rootkits), and they are well known for doing just that to evade discovery by users & antivirus programs.

To check the inactive process using psscan we can use following command:

volatility --profile=WinXPSP3x86 -f cridex.vmem psscan

The output of the command shows in the following screenshot:

psscan command in volatility

Now we can compare the outputs of both paslist and psscan to find any anomalies.

3. Psxview Plugin on Volatility

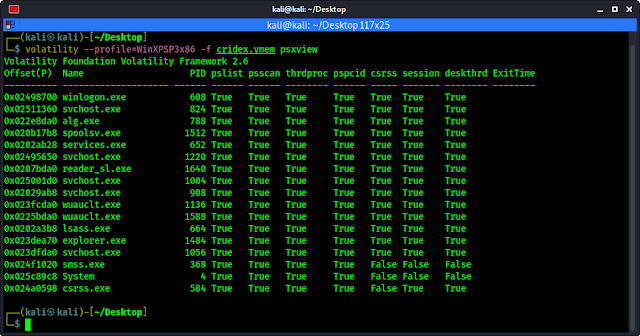
As with psscan, the psxview plugin is used to find and list hidden processes. With psxview however, a variety of scans are run, including pslist and psscan.

To run the psxview we apply following command:

volatility --profile=WinXPSP3x86 -f cridex.vmem psxview

The output of the command shows in the following screenshot:

psxview command in volatility

Analyzing Network Services & Connections using Volatility

Volatility can be used to find and analyze active, terminated, and hidden connections along with ports and processes. All the protocols are supported and Volatility also reveals details of ports used by the processes including the times the processes were started.

To do this we are going to use the following three commands:

  1. connections
  2. connscan
  3. sockets

1. Connection Plugin on Volatility

The connections command lists active connections at that time. It also displays local and remote IP with the ports and PID. The connection command can be used only for Windows XP and Microsoft 2003 server (both 32 bit and 64 bit).

To use the connections command in Volatility we can use following command:

volatility --profile=WinXPSP3x86 -f cridex.vmem connections

The following screenshot shows the output of the connections command and we can see the IP address (both local and remote) along with the port numbers and PID.

connections in volatility

2. Connscan Plugin on Volatility

The connections command displayed only on connection as active at that time. To see a list of connections that have been terminated, we can use the connscan command. This connscan command is also only for Windows XP and 2003 Server (both 32 bit and 64 bit) systems.

To use connscan we run the following command:

volatility --profile=WinXPSP3x86 -f cridex.vmem connscan

The screenshot of this command is following:

connscan on volatility

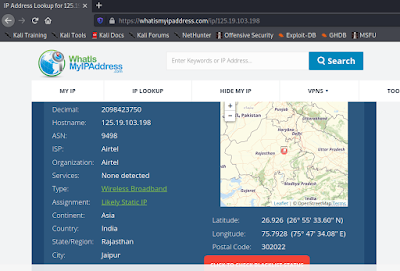
In the above screenshot we can see that same local address was previously connected to another Remote Address with the IP address 125.19.103.198 on port 8080. The PID of 1484 is proof that connection was made by the explorer.exe (tested on pslist earlier).

Here we got the Remote IP address. Now for more information we can search the IP address on some IP Look up web services like https://whatismyipaddress.com/ip-lookup or https://www.ip2location.com/demo. We got some additional information from there as we can see in the following screenshot.

searching for IP address

We can get IP details like, ISP (Internet Service Provider) name, Continent, Country and City. We also got a map co-ordinate of the city.

3. Sockets Plugin on Volatility

We use the sockets plugin to give additional connectivity information listening sockets.

To use sockets plugin we can use following command:

volatility --profile=WinXPSP3x86 -f cridex.vmem sockets

We can see the output of the command in the following screenshot:

Sokects plugin in volatility

We can see in the above that only UDP and TCP protocols are showing in this case. But sockets plugin supports all types of protocols.

Dynamic Link Libraries Analysis using Volatility

DDL a.k.a. Dynamic Link Libraries are only for Microfost (Windows & Servers). It contains code that can be used by multiple programs simultaneously.

Inspection of a process’s running DDLs and the version information of files and products may assist in correlating processes. Processes and DLL information should also be analyzed as they relate to the user accounts. For these tests we can use the following plugins:

  1. verinfo
  2. dlllist
  3. getsids

1. Verinfo plugin on Volatility

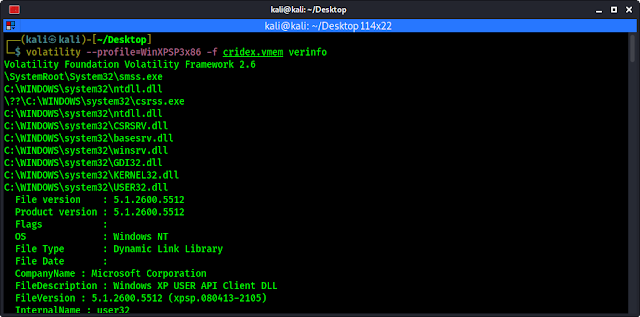
This plugin lists version information as we can see in the plugin name (verinfo) about PE (portable executable) files. The output of this file is usually quite lengthy and so can be run in a separate terminal, if we not wish to continuously scrool through the current terminal to review past plugin command lists and output.

We can use verinfo plugin by running following command:

volatility --profile=WinXPSP3x86 -f cridex.vmem verinfo

The screenshot of the command is following:

verinfo plugin in volatility

2. Dlllist plugin on Volatility

This dlllist plugin lists all running DLLs at that time in memory. DLLs are composed of code that can be used by multiple programs concurrently.

We can use the dlllist plugin by running the following command:

volatility --profile=WinXPSP3x86 -f cridex.vmem dlllist

The following screenshot shows the output of the command:

dlllist on volatility kali linux

3. Getsids plugin on Volatility

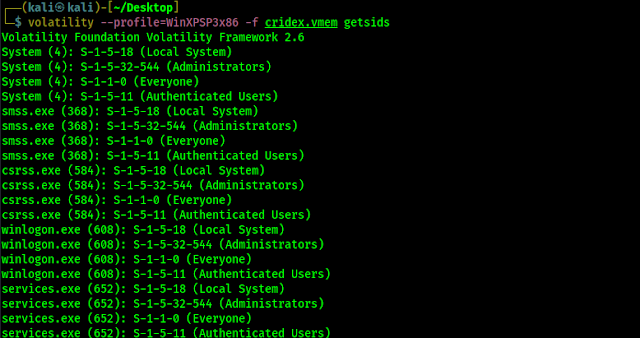
To identify all users we can use Security Identifier (SID). The getsids command has four very useful items in the order in which the processes were started (refer to pslist and pstree command screenshots).

To run the getsids we can use following command:

volatility --profile=WinXPSP3x86 -f cridex.vmem getsids

The screenshot of the command is following:

getsids on volatility

The format for the getsids plugin output is like following:

[Process] (PID) [SID] (User)

On the first line of the output we can see follwoing:

System (4): S-1-5-18 (Local System)

Here we explained in following bullets:

  • Process : System
  • PID : 4
  • SID : S-1-5-18
  • User : Local System

If the last number if SID is in a range of 500, that indicates the user with adminstratative privileges. For an example:

S-1-5-32-544 (Administrators)

Here we got something when we are scrolling down the getsids output, we can see that a user called Robert with an SID of S-1-5-21-789336058 (non-admin) has used started or accessed explorer.exe PID 1484.

Resgistry Analysis

Information about every users, settings, programs and the Windows operating system itself can be found within the registry. Even encrypted passwords can be found in the registry.

In the Windows registry analysis, we will be using the following two plugins.

  1. hivescan
  2. hivelist

1. Hivescan plugin on Volatility

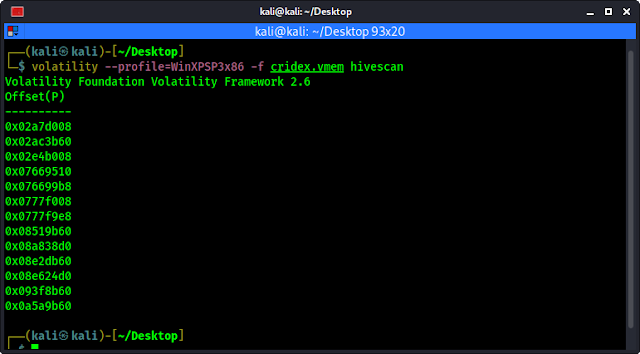
This hivesan plugin display the physical locations of available registry hives.

To use this plugin we need to run following command:

volatility --profile=WinXPSP3x86 -f cridex.vmem hivescan

We can see the physical locations of available registry hives in the following screenshot:

hivescan on volatility

2. Hivelist plugin on Volatility

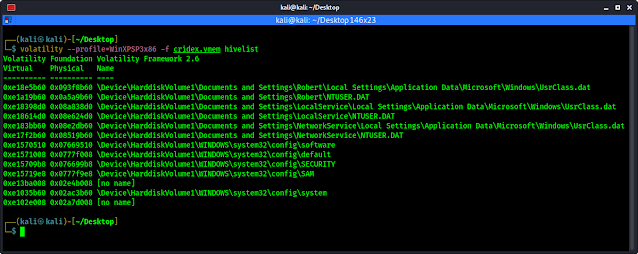
Hivelist plugin is used for more details (and helpful) information on registry hives and locations with RAM. This plugin shows the details of Virtual and Physical address along with the easier readable plaintext names and locations.

We use following command to run hivelist plugin on Volatility

volatility --profile=WinXPSP3x86 -f cridex.vmem hivelist

The output shows in the following screenshot:

hivelist on Volatility

In the above screenshot we can see information about vitual and physical address.

Password Dumping using Volatility

We know that Windows password stored on the SAM (Security Accounts Manager) file on Windows. This SAM file stores hashd passwords for usernames in Windows system. This file can’t be accessed by any user when the Windows system is on.

When we have used the hivelist command (previous screenshot) we have seen the SAM file if we carefully checked the output.

sam file on volatility
We can see the SAM file during using hivelist plugin

Timeline Investigation using Volatility

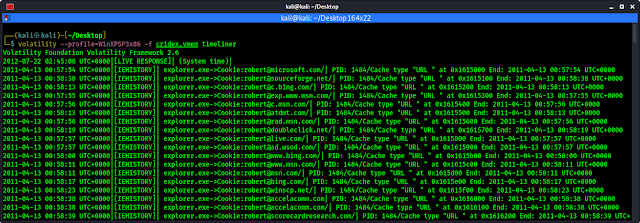
We can check timeline of all the events that took place when the image was acquired by using timeliner plugin on Volatility.

Although we have an idea of what took place within this scenario, many other dumps may be quite large and far more detailed and complex. The timeliner plugin will groups details by time and includes process, PID, process offser, DDLs used, registry details and other useful information.

To run timeliner command, we type the following command:

volatility --profile=WinXPSP3x86 -f cridex.vmem timeliner

The output shows in the following screenshot:

timeliner plugin on Volatility

This may produce long ouput and we need to scrool to see the full output.

Malware analysis

One of most important feature of Voatility is malfind plugin. This plugin is used to find, or at least direct us toward hints of malware that may have been injected into various processes.

The output of malfind plugin may be very lenghty so we should be run it in a separate terminal to avoid constant scrolling when reviewing the other plugin’s output.

The command used to run malfind pluin will be following:

volatility --profile=WinXPSP3x86 -f cridex.vmem malfind

We can see the output on the following screenshot:

malware analysis using volatility

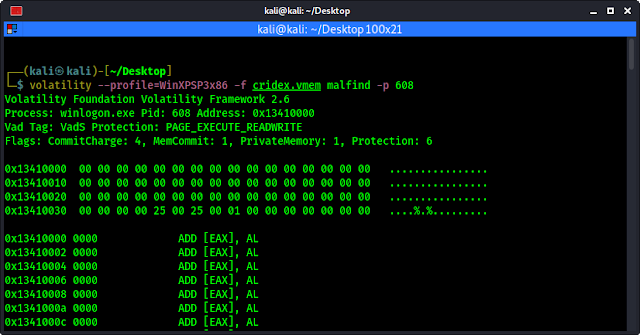
We can see a very long output here. To be more specific we can use -p flag to analyse a specific PID. As we have discovered previously (pslist plugin), winlogon.exe is assigned to PID 608. To analyze this specific PID in malfind we use following command:

volatility --profile=WinXPSP3x86 -f cridex.vmem malfind -p 608

The output of the command shown in the following screenshot:

malfind on a specific PID

Final Thoughts

In this article, we looked at memory forensics and analysis using some of the many plugins available within the Volatility Framework on our Kali Linux system.

One of the first, and most important, steps in working with Volatility is choosing the profile that Volatility will use throughout the analysis. This profile tells Volatility Framework what type of operating system is being used. Once the profile was chosen, we were able to successfully perform process, network, registry, DLL, and even malware analysis using this versatile framework.

As we’ve seen, Volatility can perform several important functions in digital forensics and should be used together with other tools we’ve used previously to perform in-depth and detailed forensic analysis and investigations.

Be sure to download more publicly available memory images and samples to test our skills in this area. Experiment with as many plugins as we can and of course, be sure to document our findings and consider sharing them online.

This is how we can perform Digital forensics on RAM and the swap partition etc using our Kali Linux system with the help of Volatility Framework.

Love our articles? Make sure to follow us on Twitter and GitHub, we post article updates there. To join our KaliLinuxInfamily, join our Telegram Group & Whatsapp Channel. We are trying to build a community for Linux and Cybersecurity. For anything we always happy to help everyone on the comment section. As we know our comment section is always open to everyone. We read each and every comment and we always reply.

100 Top Hacking Tools and Ethical Hacking Tools | Download Them Here!

Ethical hacking (also called white-hat hacking) is a type of hacking in which the hacker has good intentions and the full permission of the target of their attacks. Ethical hacking can help organizations find and fix security vulnerabilities before real attackers can exploit them.

The post 100 Top Hacking Tools and Ethical Hacking Tools | Download Them Here! appeared first on Cybersecurity Exchange.

Data Forensics with CEH

Data Forensics with CEH

Techniques and Tools In today’s digital age, cybercrime has become a significant concern for individuals and organizations worldwide. One of the critical challenges of cybercrime investigation is collecting, analyzing, and preserving digital evidence, also known as data forensics. Data forensics is the process of collecting, analyzing, and preserving digital evidence in a manner that maintains …

Data Forensics with CEH Read More »

Amap – Gather Info in Easy Way

Amap is an application mapping tool that we can use to read banners from network services running on remote ports. In our this detailed article we are going to learn hot we can use Amap on Kali Linux to acquire service banners in order to identify the services running with open ports on a target system. This is a very good information gathering tool for cybersecurity.

amap on Kali Linux

To use Amap to gather service banners, we will need to have a remote system running network services that discloses information when a client device connects to them. In our article we are going to use a Metasploitable2 instance for example. We already have an article about installing Metasploitable2.

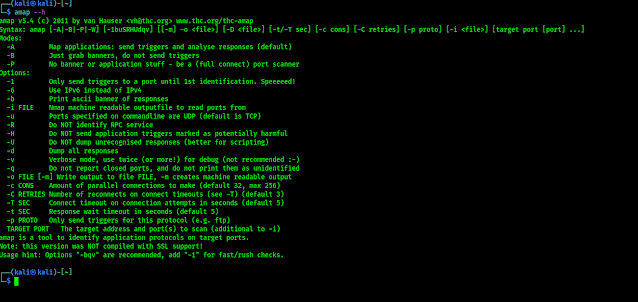
Amap is comes preloaded with our Kali Linux system so we don’t need to install it on our system, we can directly run the following command on our terminal to see the help/options of Amap:

amap --h

The output of command shown in the following screenshot:

amap help options on Kali Linux

In the above screenshot we can see that -B flag in Amap can be used to run Amap in banner mode. This have it collect banners for the specified IP and service port(s). This application can be used to collect the banner from a single service by specifying the remote IP address and port number.

For an example we run following command on our terminal:

amap -B 172.20.10.10 21

This command will scan our Metaspoitable2 IP to grab the banner of port 21. The result shown in the following screenshot:

banner garbbing on port 21 using amap

On the above screenshot, we can see that Amap has grabbed the service banner from port 21 on the Metasploitable2 system. We can also run this command to perform a scan of all the possible TCP ports, all the possible ports must need to scanned. The portions of the TCP headers that define the source & destination port address are both 16 bits in length, also each bit can retain a value of 1 or 0. So there are 216 or 65536 possible TCP port addresses. To scan all the TCP ports all we need to specify the range of 1 to 65535. We can do this by using following command on our terminal:

amap -B 172.20.10.10 1-65535

In the following screenshot we can see the output of the applied command.

amap banner grabbing of all ports

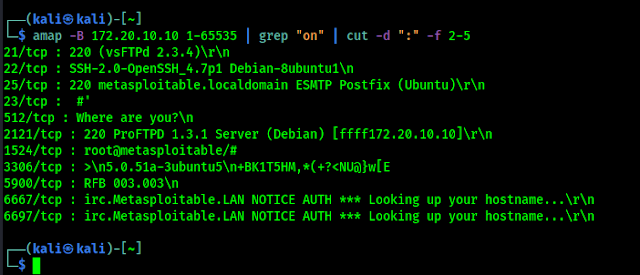
In the above screenshot we can see that we got the opened ports and their banners. Sometimes the normal output of the command shows lots of unnecessary & redundant information that can be extracted from the output. Like the IP address & metadata is there without any logic. We can filter the output using following command:

amap -B 172.20.10.10 1-65535 | grep "on" | cut -d ":" -f 2-5

Now in the following screenshot we can see that the output is to the point.

filtered output of amap

This shows the principal that tells how Amap can accomplish the task of banner grabbing is same as some other tools like Nmap. Amap cycles through the list of destination port address, attempts to establish a connection with each port, and then receives every returned banner that is sent upon connection to the service running on the port.

Love our articles? Stay updated with our articles by following us on Twitter and GitHub. Be a part of the KaliLinuxIn community by joining our Telegram Group, where we focus on Linux and Cybersecurity. We’re always available to help in the comment section and read every comment, ensuring a prompt reply.

20 Reasons You Need to Stop Stressing About SQL Injection

An SQL injection is an attacker’s method to introduce SQL queries into input fields so that the underlying SQL database may process them. This is done using a technique known as SQL injection. When input forms let user-generated SQL queries directly query the database, these vulnerabilities become exploitable and may be exploited by malicious users.

20 Reasons You Need to Stop Stressing About SQL Injection

Take, for instance, a standard login form consisting of user and email fields and a password field. This will serve as an example for you. After submitting the login information, it is merged with a SQL query running on your web server.

Reasons You Need to Stop Stressing About SQL Injection

Techniques for preventing SQL injection Given that user input channels are the primary vector for such assaults, the most effective method is monitoring and vetting user input while keeping an eye out for attack trends. Developers may also avoid vulnerabilities by using the primary preventative measures listed below.

1. Encryption: 

The most secure method for protecting this sensitive data is to encrypt them. Creating and upkeep of these computerised databases take significant work, but ensuring the databases’ safety is the primary obstacle to overcome. Code injections are among the most dangerous attacks that can be launched against these databases and the information they store.

2. Input validation: 

The validation procedure aims to determine whether or not the kind of input the user provided was permitted. Validating the input ensures that it is of the correct type, length, and format, among other things. Only the value determined to be correct after being validated may be handled. It assists in neutralizing any instructions that may have been placed into the input string. It’s like checking to see who’s there before you answer the door when someone’s pounding on it.

Validation shouldn’t only be applied to fields where users may write in data, which means you should also take an equal amount of care with the following situations:

To guarantee reliable input validation, use regular expressions as whitelists for structured data (such as name, age, income, survey answer, and zip code), such as these examples.

Determine which value was returned when there was a defined set of options to choose from (for example, a drop-down list or radio button). The information provided should be an exact match for one of the available selections.

Validation is required for any data obtained from third parties outside the organization. This regulation applies not only to the information supplied by Internet users but also to the information provided by suppliers, partners, vendors, and regulators. These suppliers could be the target of an attack that causes them to send out corrupted data even though they are unaware of it.

3. Parameterized Queries:

Queries with parameters are called parameterized queries, and they are a way to pre-compile a SQL statement so that you can then provide the parameters for the statement to be run. The database will be able to detect the code and differentiate it from the input data as a result of using this strategy.

  • To inject a user-supplied value into our queries, we may employ the parameterized query approach of preparing prepared statements with the question mark placeholder (“?”). This is a highly efficient solution, and it cannot be exploited in any way (unless the implementation of the JDBC driver has a problem, of course).This coding approach helps limit the risk of a SQL injection attack since the user input is automatically quoted, and the given input will not change the program’s intended behaviour.
  • The MySQLi extension allows for parameterized queries; however, PHP 5.1 introduced a far more effective method for interacting with databases known as PHP Data Objects (PDO). PDO uses techniques that make the usage of parameterized queries more straightforward. In addition, it makes the code simpler to understand and more portable since it can now be used with several databases rather than only MySQL.

4. Stored Procedures:

Stored procedures need the programmer to organize one or more SQL statements into a logical unit before they can generate an execution plan. This is referred to as creating a stored procedure (SP). 

  • The ability to automatically parameterize statements is made possible by subsequent executions. To put it more simply, it is a sort of code that may be saved for later use and used several times.
  • Therefore, anytime you need to put the question into action, rather than writing it out over and again, you can just use the stored procedure.

5. Escaping:

Always take advantage of the character-escaping features offered by each database management system for any user-supplied input (DBMS). This is done to ensure that the database management system (DBMS) never mistakes it for the SQL statement that the developer supplied.

6. Avoiding administrative privileges:

Using an account with root access to connect your application to the database should be avoided at all costs to avoid the need for administrative rights. Because the attackers might acquire access to the whole system, this action should only be used under dire circumstances. Even a non-administrative accounts server may pose a threat to an application. This danger would be multiplied if the database server was utilized by several other databases and applications simultaneously.
  • To protect the application against SQL injection, for this reason, it is best to apply the most restrictive privileges possible to the database. Make sure that each program has its database credentials and that those credentials have at least the minimal set of permissions required by the application.
  • Instead of figuring out which access privileges you need to remove, you should concentrate on determining which access rights or higher permissions your program requires. If a user wants access to just a subset of the features, you may design a mode dedicated only to fulfilling this need.

7. Web application firewall:

A web application firewall is one of the most effective ways to detect SQL injection threats and is one of the best practices overall (WAF). The web application firewall (WAF) sits in front of the web servers and analyzes the traffic that moves into and out of the servers. It looks for patterns that might indicate a potential security risk. In its most basic form, it is a firewall that is installed between the web application and the internet.
  • A WAF can function by using web security rules that may be specified and customized. The WAF is given direction on the kind of vulnerabilities and traffic behaviours it should look for based on these rules. Therefore, in light of this knowledge, a WAF will continue to monitor the apps and the GET and POST requests it receives to identify and prevent harmful activity.
  • The convenience with which a WAF’s policies may be modified and implemented contributes to the framework’s value. Rapid deployment of rules and a speedy reaction to incidents are made possible by the ease with which new policies may be established.
WAFs provide adequate protection against a wide variety of harmful security threats, including the following:
  • Injection of SQL syntax
  • Scripting that spans many sites (XSS)
  • Session hijacking
  • DDoS assaults, which stand for distributed denial of service attacks
  • Cookie poisoning
  • Parameter tampering
  • In addition to these advantages, a WAF also provides the following advantages:
  • Automatic protection against unknown and undiscovered attacks, with robust default rules and remedies tailored to your unique WAF architecture.
  • Application security monitoring in the real-time and comprehensive recording of HTTP traffic that enables you to see the state of things at any given moment
When developing a web security defence in-depth plan, a WAF should always be considered because of its many advantages, including the prevention of SQL injection attacks.

8. Examining for potential SQL injections:

When the integrated software is operational, it is common practice to carry out many distinct forms of security testing as part of the quality assurance (QA) procedures that are routinely carried out. Unfortunately, functional testing does not aim to exploit user input fields since the majority of testers do not think like malicious actors.
Aside from the fact that they often need the necessary resources to do so, such as the time or the direction. Testing manually for injection-type vulnerabilities is also challenging since it involves attempting many different input combinations. 
This makes the process more complicated. Fuzzing, often known as fuzz testing, is performed at this point. It generates invalid, unexpected, and unpredictable data to use as inputs to the program being tested. The objective of fuzz testing, like penetration testing, is to discover potential security flaws in a system by probing its publicly accessible interfaces.

9. Examining the Level of Penetration:

It is advantageous to do penetration testing (and, by extension, fuzz testing) since this kind of testing may uncover serious security flaws and flaws that may have crept past the procedure undetected. 
To thoroughly test all conceivable permutations and combinations, however, this kind of testing, like all other dynamic tests, is contingent on the number of tests, code, and API coverage. 
The success of penetration testing is contingent on the exhaustiveness of functional testing, which is usually carried out at the UI level. As a result, it is essential to supplement your penetration testing efforts with API testing and SAST to guarantee that you are being exhaustive.

10. Testing of the API:

API testing helps move left functional and security testing by reducing the need for fragile and time-consuming UI tests. This helps shift left available and security testing. The application programming interface (API) layer is where most of the application’s functionality is located. Testing at this level is more resistant to change and simpler to automate and maintain.

11. API-Level Penetration Testing:

Utilizing software such as Parasoft SOAtest, it is feasible to do API-level penetration testing to uncover SQL injection vulnerabilities. This testing generates automated fuzz tests from pre-existing functional tests to test the application’s business logic. Integration with the well-known penetration testing tool Burp Suite is one of the features offered by Parasoft SOAtest.
API calls described in the test are recorded together with the request and response traffic when functional test scenarios are executed using Parasoft SOAtest. On each test, the Burp Suite Analysis Tool will send the traffic data to a separate instance of the Burp Suite application running in the background. This application instance will then perform penetration testing on the API based on the API parameters it observes in the traffic data using its heuristics.
Any issues discovered by Burp Suite will subsequently be reported as errors inside SOAtest, connected to the test that visited the API through the Burp Suite Analysis Tool. The findings of Parasoft SOAtest are delivered onto a dashboard for reporting and analytics maintained by Parasoft. To provide extra tools for reporting.

12. JPA Criteria API

Considering that the construction of explicit JQL queries is the most common cause of SQL injections, we need to promote the usage of JPA’s Query API wherever it is an option.

13. User Data Sanitization

Data sanitization is a method that involves applying a filter to user-supplied data to make it suitable for usage by other components of our program in a secure manner. Allowlists and blocklists are the primary categories into which filters may be placed, even though their implementations might differ quite a bit.
Be sure that the embedded instructions comprising various data inputs cannot be included in the SQL-specific syntax that SQL recognizes. 
This is a significant security measure. Some data, which may be entered into JSON files without risk, may cause damage to SQL queries and SSH commands

14. Damage Control Techniques:

The idea that we should always construct several protection layers is called the “defense in depth” principle. This is an intelligent security practice. Even if we cannot discover all of the potential flaws in our code – which is a regular occurrence when working with old systems – we should, at the very least, make an effort to restrict the amount of harm that an attack might cause. This is the fundamental principle.

15. Employ the concept of the lowest possible privilege: 

Put as many restrictions as possible on the privileges of the account used to access the Database. Make use of the database-specific mechanisms available to provide an extra layer of security; for instance, the H2 Database has a session-level option that disables all literal values on SQL Queries.

16. Use credentials with a limited shelf life: 

Instruct the application to rotate database credentials often; an innovative method is Spring Cloud Vault.

17. Document everything:

If the application saves client data, then this is an absolute must; several solutions are available that either interface directly with the Database or function as proxies, allowing us to at least evaluate the damage in the event that an attack occurs.
Utilize Web Application Firewalls (WAFs) or other intrusion detection solutions comparable to these: these are the standard instances of blocklists; typically, they come with a massive database of known attack signatures and will trigger a programmed action upon detection. 
Some additionally incorporate in-JVM agents that can identify intrusions by applying some instrumentation. The primary benefit of this method is that it makes it much simpler to patch a potential vulnerability since we will have access to the whole stack trace.

18. Don’t use dynamic SQL; instead, use prepared statements:

Refrain from incorporating users’ supplied data straight into SQL queries. It is required to turn off “data interpretation” to accomplish this goal. This will ensure that the data will not be processed once it has been put into the Database. Even if it is set in the structure of a SQL query, the system will not begin to execute it; instead, it will just place the data in its current state.

19. Limit Database Permissions

Employ the concept of the least privilege possible (POLP). Users must have access at the highest level possible while working on the website since they may be making changes. However, before selecting the “full rights” option that allows unrestricted access, you should consider it seriously first. Instead, it would help if you were sure that the individual who demands the most significant degree of access is, in fact, in need of it to carry out their responsibilities.

20. Restriction of the Display of Particular Errors

On some login screens, an error message that reads “User ‘JohnDoe123’ was not found” may appear if a user enters the incorrect username. By being this detailed, you invite hackers to join your account through brute force. To put it another way, attackers may keep typing in various usernames until the banner is no longer visible. Either restrict the error display’s visibility or turn it off entirely if you want to stop this from happening. This restricts access to the error log to your internal users, ensuring that only they can resolve problems if they arise.
It is also possible to implement the procedure for preventing SQL injections within your company so that you can instruct the employees on what aspects are essential to pay attention to whenever new updates are planned. In addition, it is also possible to implement the procedure for preventing SQL injections within your company.

Conclusion:

Prevention techniques such as input validation, parameterized queries, stored procedures, and escape are effective against various attack vectors. However, they are often inadequate to safeguard databases because of the significant variation in the pattern of SQL injection attacks.
Therefore, to ensure that you have covered all of your bases, you should use the tactics discussed thus far in conjunction with a reliable WAF if you use cyber security news. The most important advantage a WAF provides is the security it offers to bespoke web applications that, in the absence of this feature, would be unprotected.

Acquire RAM for Forensics Testing

In a previous article we talked about how to perform digital forensics testing of RAM using Volatility framework. But we didn’t talk about how we can acquire Random Access Memory (RAM) for a digital forensics test.

Here we use FTK Imager (Forensic Toolkit Imager) for our memory capturing job. We can install on a Windows computer (latest version of FTK Imager 4.5 comes for Windows only). After that we can acquire RAM.

Acquire RAM data for digital forensics using FTK Imager

FTK Imager can acquire primary storage systems also, but there are lots of article there in the internet about it. Here we are going to about how we can acquire a system’s volatile memory (RAM) for forensics purpose.

First of all we need to download the latest FTK Imager tool from the official website https://accessdata.com/product-download/ftk-imager-version-4-5.

ftkimager dowload

After clicking on “Download Now” we got a page to fill up a form and we need to put our mail-id there and then the download link will be mailed to us as we can see the following screenshot:

ftkimager download link in mail

Here we can click to “Download FTK Imager” button. We need to click here then the download process will be started. This will be a less than 50MB exe file.

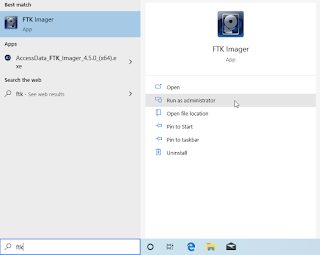
After downloading we can install it as other Windows applications. Then we just need to run it as an administrator, shows in the following screenshot:

ftk imager run as admin

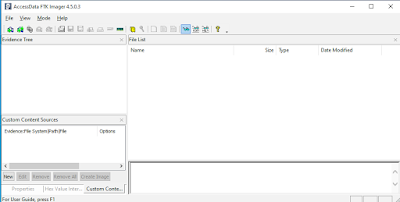
Then FTK Imager will open in front of us as we can see in the following screenshot:

ftkimager home screen

After this we click on the “File” located top left corner. Then we click on “Capture Memory” in the drop down menu. Showed in thee following screenshot:

capture Memory on FTK Imager

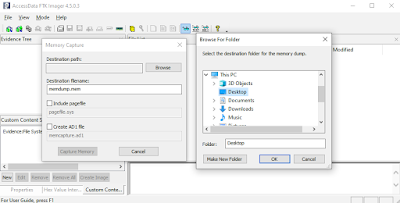
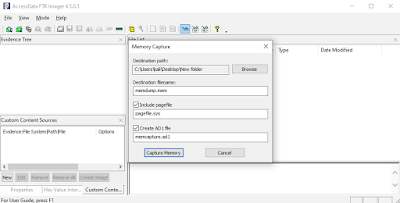
Then a popup box will open, here we can browse the destination folders path, where we want to save the acquired memory dump. Shown in the following screenshot:

fftkimager set destination path

After choosing the output folder we need to check (✅) for pagefile and AD1 file.

FTK Imager set for acquire RAM

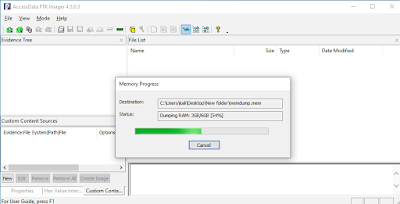
Then we just need to click on “Capture Memory” and the memory acquiring will started. Shown in the following screenshot:

memory acquiring on ftk imager

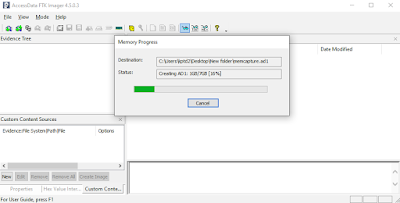
After finishing the memory acquiring it will start capturing pagefile and AD1 file, as the following screenshot:

creating AD1 file ftkimager

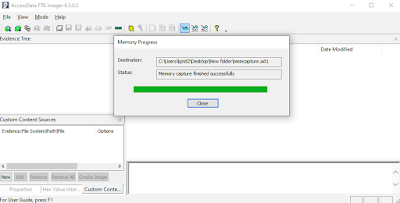
Once the acquisition is completed, we can click on the “Close” button, as shown in the following screenshot:

ftkimager ram acuring complete

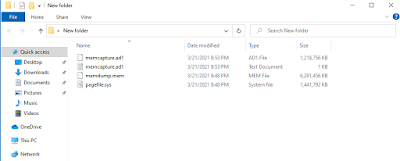
Now we are Done. We can see the output files on our selected destination folder.

FTK Imager captured RAM dump

Now we can easily test this .mem file using Volatility on Kali Linux machine. We had talked about Volatility and it’s uses previously.

This is how can capture RAM for forensics testing. RAM’s data is very volatile, when there are no electrical charge or current in the RAM chip. With the data on RAM being the most volatile, it ranks high in the order of volatility and must be forensically acquired and preserved as a matter of high priority.

Love our articles? Make sure to follow us on Twitter and GitHub, we post article updates there. To join our KaliLinuxIn family, join our Telegram Group. We are trying to build a community for Linux and Cybersecurity. For anything we always happy to help everyone on the comment section. As we know our comment section is always open to everyone. We read each and every comment and we always reply.

Hping3 — Network Auditing, DOS and DDOS

Hping3 is a command-line tool that allow us to analyze TCP/IP messages on a network. Also Hping3 can assemble network packets, which can be very useful for pentesters in performing device and service discovery and illegal actions like performing a Denial-Of-Service (DoS) attack.

hping3 kali linux dos and ddos

Hping3 comes pre-installed with Kali Linux. It is very useful for testing a network.

Key Features of Hping3

  1. Host discovery on a network.
  2. Fingerprinting host devices to determine services.
  3. Sniffing network traffic.
  4. Denial of Service (DoS).
  5. File Transfer.

Host Discovery on a Network

In the real world there are many servers and devices that have ICMP responses disabled for security reasons. We can useHping3 to probe a port on a target system to force an ICMP response back.

First we use the ping utility to send ping request on our localhost server.

ping with no response

On the above screenshot we can see that we don’t receive any responses from the target. Novice guys may assume that target is offline and would probably move on.

If we use Hping3 to probe a specific port by sending SYN packets will force the target to reveal itself.

sudo hping3 -S 192.168.225.48 -p 80 -c 2

Here we have specified SYN packets using -S flag, and specify the port 80 using -p 80. After applying the above command we got following response shown in the screenshot:

hping3 response

From the above screenshot we can see that we have received successful responses from our target. This means our target is open.

Sending Files using Hping3

We can also send files using hping3. For an example we just send a text file from our Linux Mint virtual machine to our host Kali Linux machine. First we start listener on our machine where we want to download our file by using following command:

sudo hping3 -1 192.168.225.29 -9 signature -I wlan0

Here the -1 flag used for ICMP and the IP address is the sender’s IP. -9 flag is used to start the listener and -I is used to choose the network interface. Then the listener will start as we can see in the following screenshot:

Hping3 listener mode

After starting the listener mode here we can send the file from another machine by using following command:

sudo hping3 -1 192.168.225.29 -e signature -E hping3.txt -d 2000

Here -e flag is used to give a signature and -E flag is used for sending file data, -d flag used for size of data.

The following screen recording shows how it works.

Sniffing Network Traffic using Hping3

We also can use hping3 as a network packet sniffer. Here also we can use hping3’s listener mode and intercept and save all traffic going through our machine’s network interface.

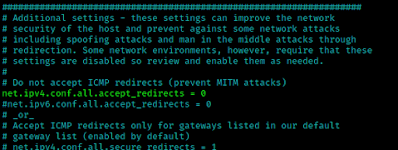
First we need to allow this (uncomment)

net.ipv4.conf.all.accept_redirects = 0

in /etc/sysctl.conf file. Shows in the following screenshot:

allow in the configuration

For an example, to intercept all traffic containing HTTP signature we can apply the following command:

sudo hping3 -9 HTTP -I wlan0

In the following screenshot we can see the output.

hping3 packet capturing

On the above screenshot we can see that hping3 is capturing packets on the wlan0 network interface.

Denial of Service (DOS) using Hping3

We can do denial of service of DoS attack (SYN flood) using hping3. Simple command will be like following:

sudo hping3 -S --flood -V www.examplesite.com

Here -S indicates that we are using SYN packets, –flood is for sending packets as soon as possible. 

Also we can do this batter by using some advanced features.

sudo hping3 -c 20000 -d 120 -S -w 64 -p TARGET_PORT --flood --rand-source TARGET_SITE

Here -c flag is used for packet count (we can raise or decrees it as per our requirements) -d flag is for size of data, -w is to set window size, -p flag is used to specify the destination port, –rand-source flag is used to randomize the source.

This is how we can use hping3 on our Kali Linux system. We can read more about hping3 here. Hping3 is great utility for testing a network, it also very popular.

Disclaimer: This tutorial is for educational propose. Attacking others devices considered as criminal offense. We don’t support that. This is for spreading cybersecurity awareness. If anyone do any illegal stuffs then only that person will be responsible for it.

Love our articles? Make sure to follow us on Twitter and GitHub, we post article updates there. To join our KaliLinuxIn family, join our Telegram Group. We are trying to build a community for Linux and Cybersecurity. For anything we always happy to help everyone on the comment section. As we know our comment section is always open to everyone. We read each and every comment and we always reply.

Open Whatsapp chat
Whatsapp Us
Chat with us for faster replies.