Graphing Metrics
CloudWatch lets you visualize your metrics by graphing data points over time. This is useful for showing trends and changes over time, such as spikes in usage.
CloudWatch can perform statistical analysis on data points over a period of time and graph the results as a time series. You can choose from the following statistics: Sum The total of all data points in a period Minimum The lowest data point in a period Maximum The highest data point in a period Average The average of all data points in a period Sample count The number of data points in a period Percentile The data point of the specified percentile. You can specify a percentile of up to two decimal places. For example, 99.44 would yield the lowest data point that’s higher than 99.44 percent of the data points in the period. You must specify a percentile statistic in the format p99.44. To graph a metric, you must specify the metric, the statistic, and the period. The period can be from 1 second to 30 days, and the default is 60 seconds. If you want CloudWatch to graph a metric as is, use the Sum statistic and set the period equal to the metric’s resolution. For example, if you’re using detailed monitoring to record the CPUUtilization metric from an EC2 instance, that metric will be stored at one-minute resolution. Therefore, you would graph the CPUUtilization metric over a period of one minute using the Sum statistic. To get an idea of how this would look, refer to Figure 7.1.
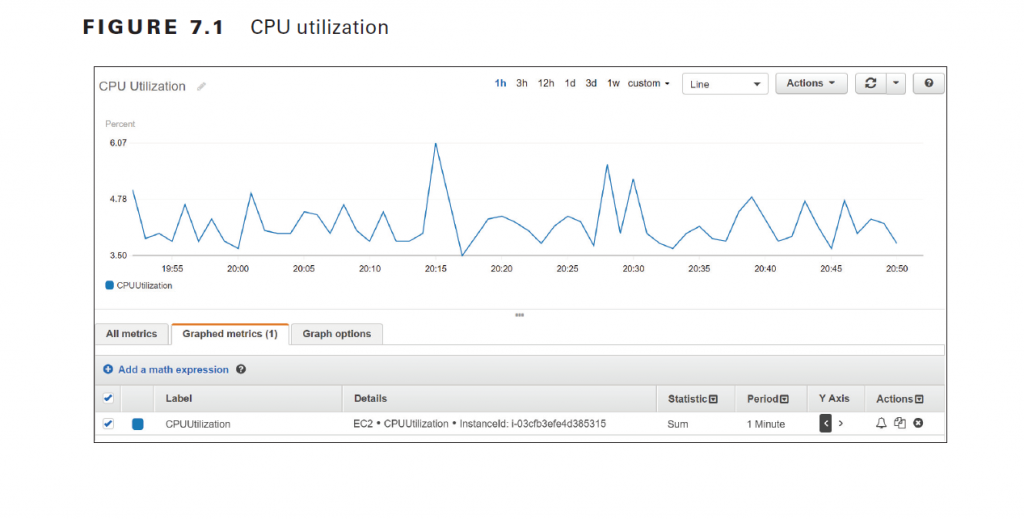
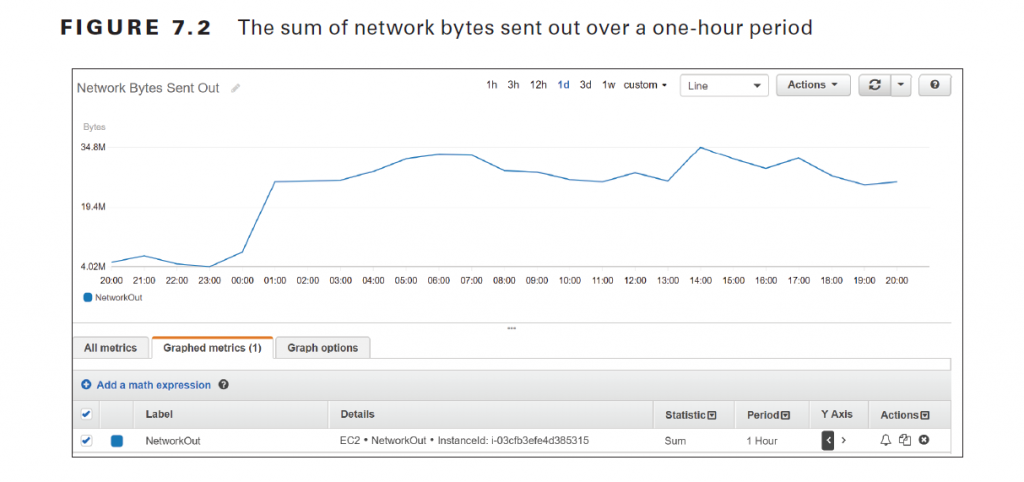
Note that the statistic applies only to data points within a period. In the preceding example, the Sum statistic adds all data points within a one-minute period. Because CloudWatch stores the metric at one-minute resolution, there is only one data point per minute. Hence, the resulting graph shows each individual metric data point. The time range in the preceding graph is set to one hour, but you can choose a range of time between 1 minute and 15 months. Choosing a different range doesn’t change the time series, but only how it’s displayed. Which statistic you should choose depends on the metric and what you’re trying to understand about the data. CPU utilization fluctuates and is measured as a percentage, so it doesn’t make much sense to graph the sum of CPU utilization over, say, a 15 minute period. It does, however, make sense to take the average CPU utilization over the same timeframe. Hence, if you were trying to understand long-term patterns of CPU utilization, you may use the Average statistic over a 15-minute period. The NetworkOut metric in the AWS/EC2 namespace measures the number of bytes sent by an instance during the collection interval. To understand peak hours for network utilization, you may graph the Sum statistic over a one-hour period and set the time range to one day, as shown in Figure 7.2. The Details column shows information that uniquely identifies the metric: the
namespace, metric name, and the metric dimension, which in this case is InstanceId.
Metric Math
CloudWatch lets you perform various mathematical functions against metrics and graph them as a new time series. This is useful for when you need to combine multiple metrics into a single time series by using arithmetic functions, which include addition, subtraction, multiplication, division, and exponentiation. For example, you might divide the AWS/ Lambda Invocations metrics by the Errors metric to get an error rate.
In addition to arithmetic functions, CloudWatch provides the following statistical functions that you can use in metric math expressions:
■ AVG—Average
■ MAX—Maximum ■ MIN—Minimum
■ STDDEV—Standard deviation
■ SUM—Sum
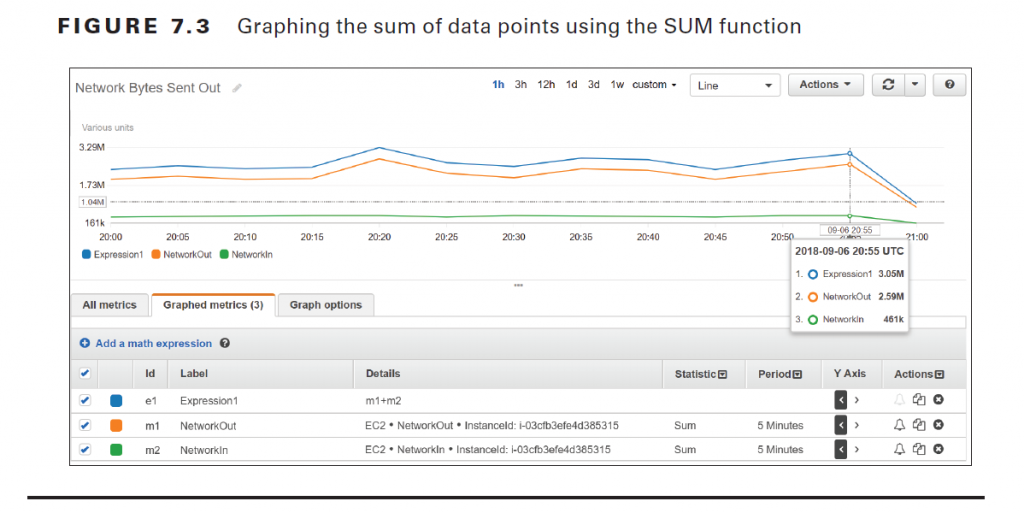
Statistical functions return a scalar value, not a time series, so they can’t be graphed. You must combine them with the METRICS function, which returns an array of time series of all selected metrics. For instance, referring to step 6 in Exercise 7.2, you could replace the expression m1+m2 with the expression SUM(METRICS()) to achieve the same result. As another example, suppose you want to compare the CPU utilization of an instance with the standard deviation. You would first graph the AWS/EC2 metric CPUUtilization for the instance in question. You’d then add the metric math expression METRICS()/ STDDEV(m1) where m1 is the time series for the CPUUtilization metric. See Figure 7.4 for an example of what such as graph might look like.
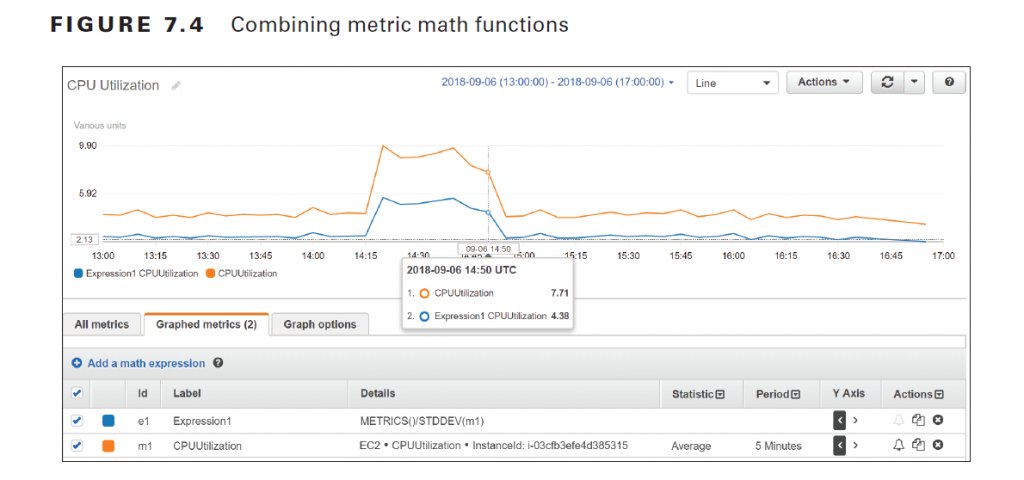
Keep in mind that the function STDDEV(m1) returns a scalar value—the standard deviation of all data points for the CPUUtilization metric. You must therefore use the METRICS function in the numerator to yield a time series that CloudWatch can graph.
CloudWatch Logs
CloudWatch Logs is a feature of CloudWatch that collects logs from AWS and non-AWS sources, stores them, and lets you search and even extract custom metrics from them. Some common uses for CloudWatch Logs include receiving CloudTrail logs, collecting application logs from an instance, and logging Route 53 DNS queries.
Log Streams and Log Groups
CloudWatch Logs stores log events that are records of activity recorded by an application or AWS resource. For CloudWatch Logs to understand a log event, the event must contain a timestamp and a UTF-8 encoded event message. CloudWatch Logs stores log events from the same source in a log stream. The source may be an application or AWS resource. For example, if you have multiple instances running a web server that generates access logs, each instance would send that log to CloudTrail as a separate stream. You can manually delete log streams, but not individual log events. CloudWatch organizes log streams into log groups. A stream must exist in only one log group. To organize related log streams, you can place them into the same log group. There’s no limit to the number of streams in a group. You may define the retention settings for a log group, choosing to keep log events from between 1 day to 10 years or indefinitely, which is the default setting. The retention settings apply to all log streams in a log group. You can manually export a log group to an S3 bucket for archiving.
Metric Filters
You can use metric filters to extract data from logs in a log group to create CloudWatch metrics. You can create a metric filter to track the occurrences of a string at a particular position in a log file. For example, you may want to track the number of 404 Not Found errors that appear in an Apache web server application log. You would create a metric filter to track the number of times the string “404” appears in the HTTP status code section of the log. Every time CloudWatch Logs receives a log event that matches the filter, it increments a custom metric. You might name such a metric HTTP404Errors and store it in the
custom Apache namespace. Of course, you can then graph this metric in CloudWatch. Metric values must be numeric. You can use a metric filter to extract a numeric value, such as the number of bytes transferred in a request, and store that in a metric. But you can’t use a metric filter to extract a non-numeric string, such as an IP address, from a log and store it as a metric. You can, however, increment a metric when the metric filter matches a specific string. Metric filters apply to log groups, and you can create a metric filter only after creating the group. Metric filters are not retroactive and will not generate metrics based on log events that CloudWatch recorded before the filter’s creation.
Also read this topic: Introduction to Cloud Computing and AWS -1
CloudWatch Agent
The CloudWatch Agent collects logs from EC2 instances and on-premises servers running Linux or Windows operating systems. The agent can also collect performance metrics, including metrics that EC2 doesn’t natively produce, such as memory utilization. Metrics generated by the agent are custom metrics and are stored in a custom namespace that you specify.
Sending CloudTrail Logs to CloudWatch Logs
You can configure CloudTrail to send a trail log to a CloudWatch Logs log stream. This lets you search and extract metrics from your trail logs. Remember that CloudTrail generates trail logs in JSON format and stores them in an S3 bucket of your choice, but it doesn’t provide a way to search those logs. CloudWatch understands JSON format and makes it easy to search for specific events. For example, to search for failed console logins, you would filter the log stream using the following syntax:{$.eventSource = "signin.amazonaws.com" && $.responseElements.ConsoleLogin =
"Failure" }
You must specify a log group and an IAM role to use. CloudTrail can create the role for you and then assume the role to create the log group. CloudTrail then begins automatically delivering new trail logs to CloudWatch Logs. Delivery isn’t instant, and it can take a few minutes before trail logs show up in CloudWatch Logs. Complete Exercise 7.3 to configure your existing CloudTrail to deliver trail logs to CloudWatch Logs. CloudTrail does not send log events larger than 256 KB to CloudWatch Logs. Hence, a single RunInstances call to launch 500 instances would exceed this limit. Therefore, make sure you break up large requests if you want them to be available in CloudWatch Logs.
CloudWatch Alarms
A CloudWatch alarm watches over a single metric and performs an action based on its value over a period of time. The action CloudWatch takes can include things such as sending an email notification, rebooting an instance, or executing an Auto Scaling action. To create an alarm, you fist defi ne the metric you want CloudWatch to monitor. In much the same way CloudWatch doesn’t graph metrics directly but graphs metric statistics over a period, CloudWatch alarms does not directly monitor metrics. Instead, it performs statistical analysis of a metric over time and monitors the result. This is called the data point to monitor .
Data Point to Monitor
Suppose you want to monitor the average of the AWS/EBS VolumeReadOps metric over a 15-minute period. The metric has a resolution of 5 minutes. You would choose Average for the statistic and 15 minutes for the period. Every 15 minutes CloudWatch would take three metric data points—one every 5 minutes—and would average them together to generate a single data point to monitor. If you use a percentile for the statistic, you must also select whether to ignore data points until the alarm collects a statistically significant number of data points. What constitutes statistically significant depends on the percentile. If you set the percentile to .5 (p50) or greater, you must have 10/1(1-percentile) data points to have a statistically significant sample. For instance, if you use the p80 statistic, a statistically significant number of data points would be 10/(1-.8) or 50. If the percentile is less than .5, you need 10/percentile data points to have a statistically significant sample. Supposing you were using the p25 statistic, you’d need 10/(.25) or 40 data points. If you choose to ignore data points before you have statistically significant sampling, CloudWatch will not evaluate any of them. In other words, your alarm will be effectively disabled.
Threshold
The threshold is the value the data point to monitor must meet or cross to indicate something is wrong. You defi ne a threshold by specifying a value and a condition. If you want to trigger an alarm when CPUUtilization meets or exceeds 50 percent, you would set the threshold for that alarm to >= 50 . Or if you want to know when CPUCreditBalance falls below 800, you would set the threshold to < 800 .
People also ask this Questions
- What is a defense in depth security strategy how is it implemented?
- What is AWS Solution Architect?
- What is the role of AWS Solution Architect?
- Is AWS Solution Architect easy?
- What is AWS associate solutions architect?
- Is AWS Solutions Architect Associate exam hard?
Infocerts, 5B 306 Riverside Greens, Panvel, Raigad 410206 Maharashtra, India
Contact us – https://www.infocerts.com

